Reason to trust

How Our News is Made
Strict editorial policy that focuses on accuracy, relevance, and impartiality
Ad discliamer
Morbi pretium leo et nisl aliquam mollis. Quisque arcu lorem, ultricies quis pellentesque nec, ullamcorper eu odio.
Bitcoin’s price appears to have resumed its downward trajectory after briefly recovering to the $87,000 level earlier this week. At the time of writing, Bitcoin has experienced a 5.7% decline in the past 24 hours, bringing its price significantly below recent highs.
Currently, BTC is down approximately 24.7% from its all-time high recorded above $109,000 in January, highlighting ongoing bearish pressure in the market.
As Bitcoin continues to navigate turbulent market conditions, analysts are paying close attention to various indicators to predict the asset’s next move.
Bull Score Index and Spent Output Age Bands Indicator
CryptoQuant analyst Julio Moreno recently highlighted the significance of the CryptoQuant Bull Score Index, a tool designed to measure market sentiment for Bitcoin.
According to Moreno, the Bull Score Index has been flashing bearish signals—below the critical threshold of 40—since Bitcoin traded around $96,000. At present, the Index has dropped even further, reaching a remarkably low level of 10, indicating severely bearish market conditions.

The Bull Score Index is a metric developed to quantify the bullish or bearish sentiment of the Bitcoin market. Scores closer to 100 indicate highly bullish sentiment, suggesting strong buying momentum, while scores approaching 0 indicate overwhelmingly bearish conditions, with significant selling pressure and negative market sentiment.
With the index now at 10, investor confidence appears notably weakened, pointing towards caution in the short term. Adding to these bearish signals, another CryptoQuant analyst, Maartunn, reported increased activity among older BTC holders, known as «Spent Output Age Bands.»
This indicator measures the age of Bitcoin that is actively being moved or transacted. When a large volume of older coins (coins held for several years) is moved, it typically suggests that long-term holders might be preparing to sell.
1,057 Bitcoin that hadn’t moved in 7–10 years just woke up.
Long-term holders may be preparing to sell. https://t.co/A6I7Mo3ljX
— CryptoQuant.com (@cryptoquant_com) April 3, 2025
Maartunn noted that over 1,057 BTC aged between 7 to 10 years recently moved, pushing this indicator above the critical 50 threshold, signifying potential increased selling pressure from long-term investors.
Contrasting Views from Technical Indicators
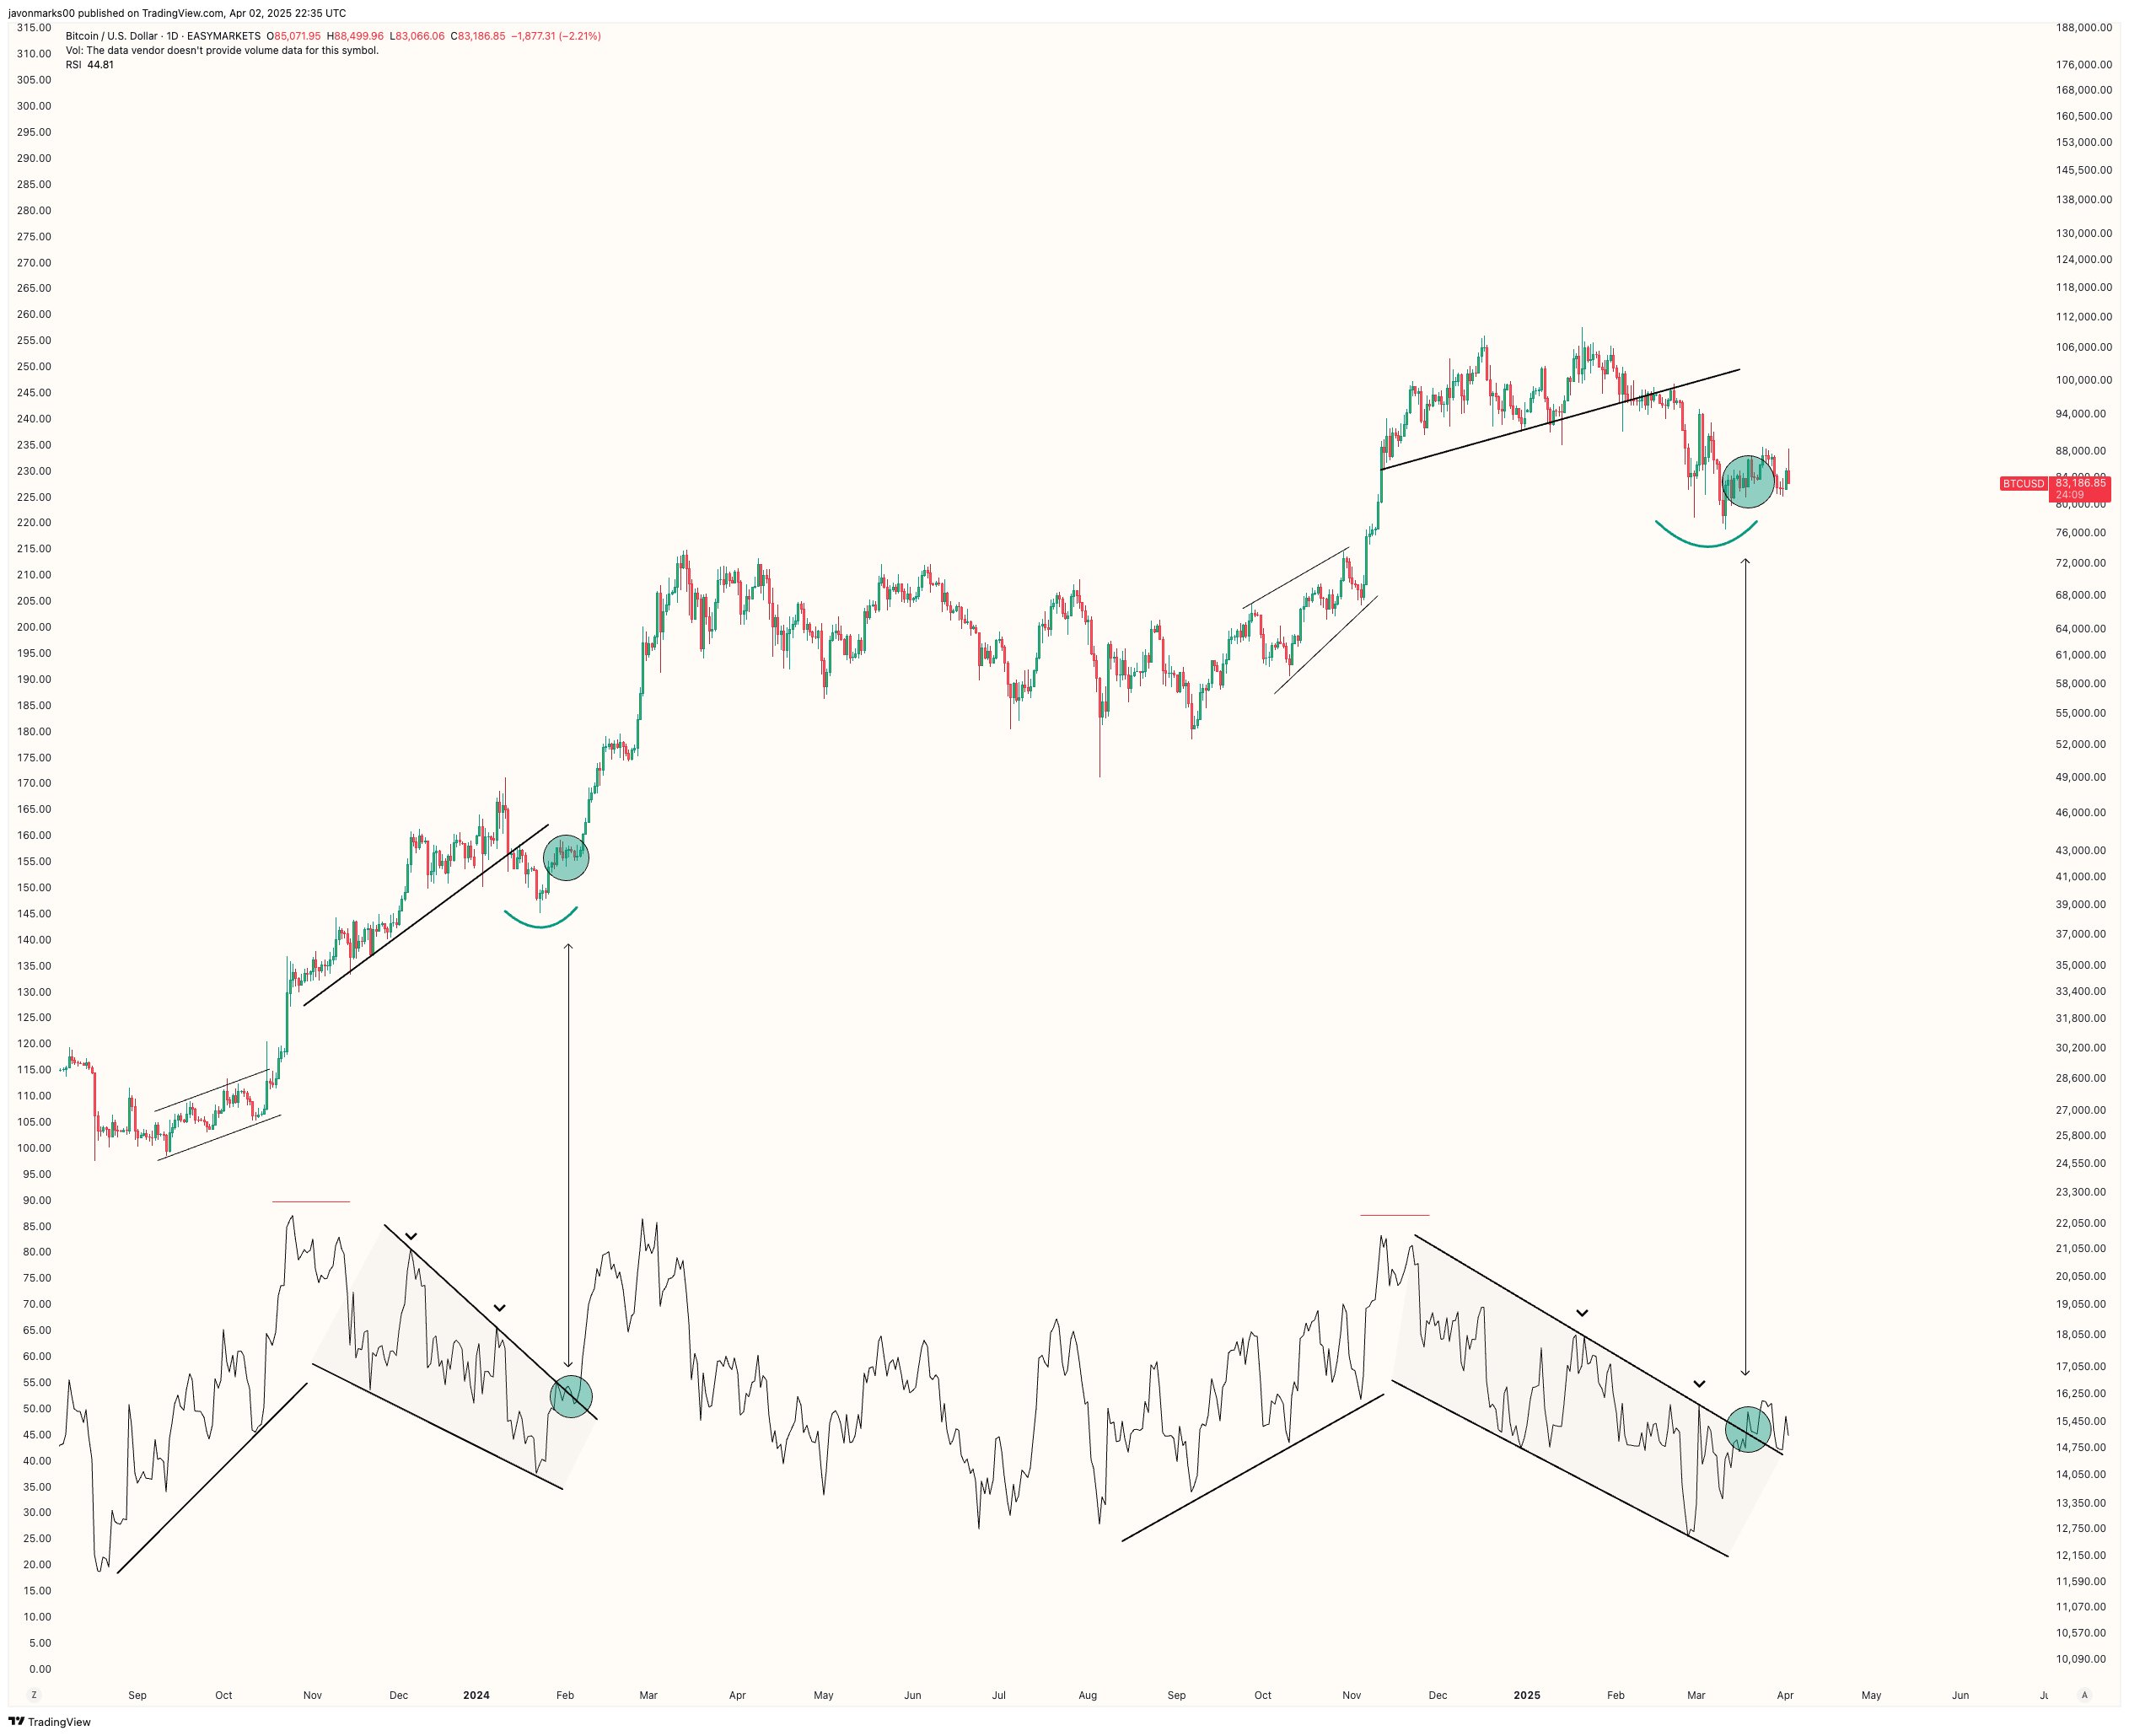
Despite these bearish warnings, some analysts remain optimistic about Bitcoin’s potential near-term performance. Crypto analyst Javon Marks has pointed to the Relative Strength Index (RSI), a momentum indicator that measures the speed and change of recent price movements, to justify his bullish stance.

A breakout in the RSI typically signals growing bullish momentum and could precede significant price increases. According to Marks, Bitcoin’s daily RSI has recently held its breakout level, similar to previous bullish occurrences that have historically preceded significant upward moves.
However, another analyst known as Titan of Crypto has issued a cautionary note. Titan stressed that Bitcoin needs to maintain its position within a key support channel and keep the weekly RSI above important support levels to avoid further correction.
If Bitcoin fails to hold these levels, Titan predicts that a deeper market downturn could ensue, causing additional challenges for traders and investors.
Featured image created with DALL-E, Chart from TradingView


