In this episode of NewsBTC’s daily technical analysis videos, we examine the total cryptocurrency market cap (TOTAL) following Ethereum Merge-related disappointments and sideways Bitcoin price action, and attempt to understand how long crypto winter might last.
Take a look at the video below:
When Will The Cryptocurrency Market Bottom And What Next?
Sentiment, price action, and technical indicators all are behaving similarly to the 2018 bear market bottom. If no new lows are made, taking a bars pattern fractal from the bear market bottom and fitting it over the current price action could give some clues into what to expect.
Fitting the fractal perfectly involves increasing its size slightly, which results in a higher high if the similarities were to continue. The higher high would also occur at around the same trend line where the last double top formed.
Connecting resistance levels and support levels could create the structure of a rising wedge or in Elliott Wave terms, an ending diagonal. Ending diagonals form when an asset’s price has climbed far too much too fast.
https://twitter.com/tonyspilotroBTC/status/1571961124219650055
The fractal would provide the final wave 5 before a larger bear market in crypto. In Elliott Wave Theory, wave 5 can often match the magnitude of wave 1, which makes price and technicals behaving similarly as wave 1 that much more notable here.
Although wave 3 is typically the longest in Elliott Wave Theory, there is evidence that in commodities, wave 5 is the strongest due to supply and demand. In the past, cryptocurrencies have shown impressive performance during a wave 5.
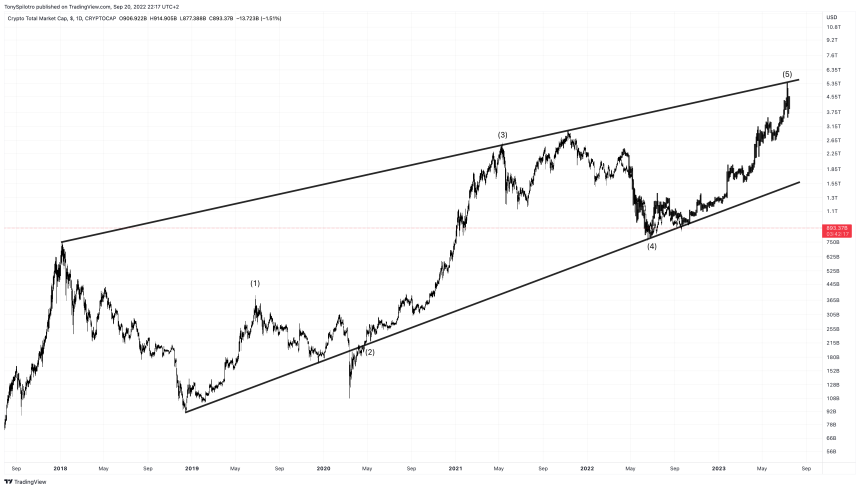
Could a wave 5 in crypto still be left in the bull market? | Source: TOTAL on TradingView.com
Total Market Cap More Bullish Than Bitcoin
On weekly timeframes, the Total Crypto Market Cap is much more bullish than Bitcoin, having crossed bullish on the LMACD long ago, while Bitcoin waits for the signal to confirm with a weekly close.
The Relative Strength Index also reached oversold conditions, which in the past has been enough to put in a bottom in crypto. Unlike BTC, the Total Crypto Market cap is clinging onto the 200-week Moving average, which in the past has also signaled the end of crypto winter.
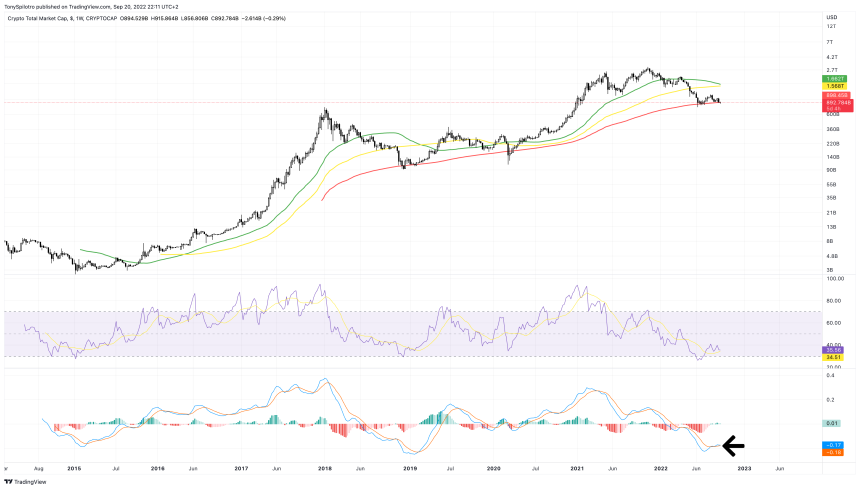
Several signals from the last crypto winter have appeared | Source: TOTAL on TradingView.com
Related Reading: WATCH: Bitcoin Barely Holds Onto $20,000 Support | BTCUSD September 16, 2022
Why Crypto Winter Could Last Another Several Months
Flipping to monthly timeframes, also shows that the 50-month moving average is also doing its best to keep crypto afloat.
Although daily and weekly timeframes show several key similarities with the 2018 bear market bottom, the monthly timeframe’s current candlestick structure better resembles the 2014 bear market bottom, which when compared, could suggest that the crypto winter has several more months to go before prices begin to thaw out.
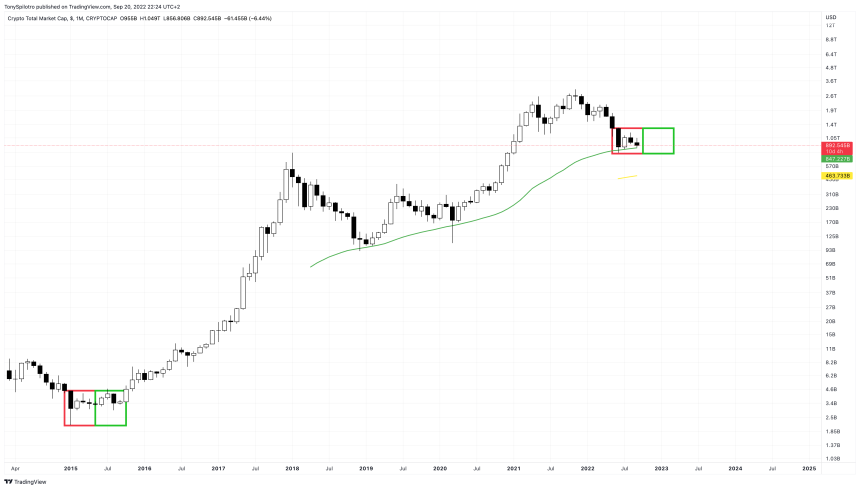
How much longer will crypto winter last? | Source: TOTAL on TradingView.com
Learn crypto technical analysis yourself with the NewsBTC Trading Course. Click here to access the free educational program.
Follow @TonySpilotroBTC on Twitter or join the TonyTradesBTC Telegram for exclusive daily market insights and technical analysis education. Please note: Content is educational and should not be considered investment advice.
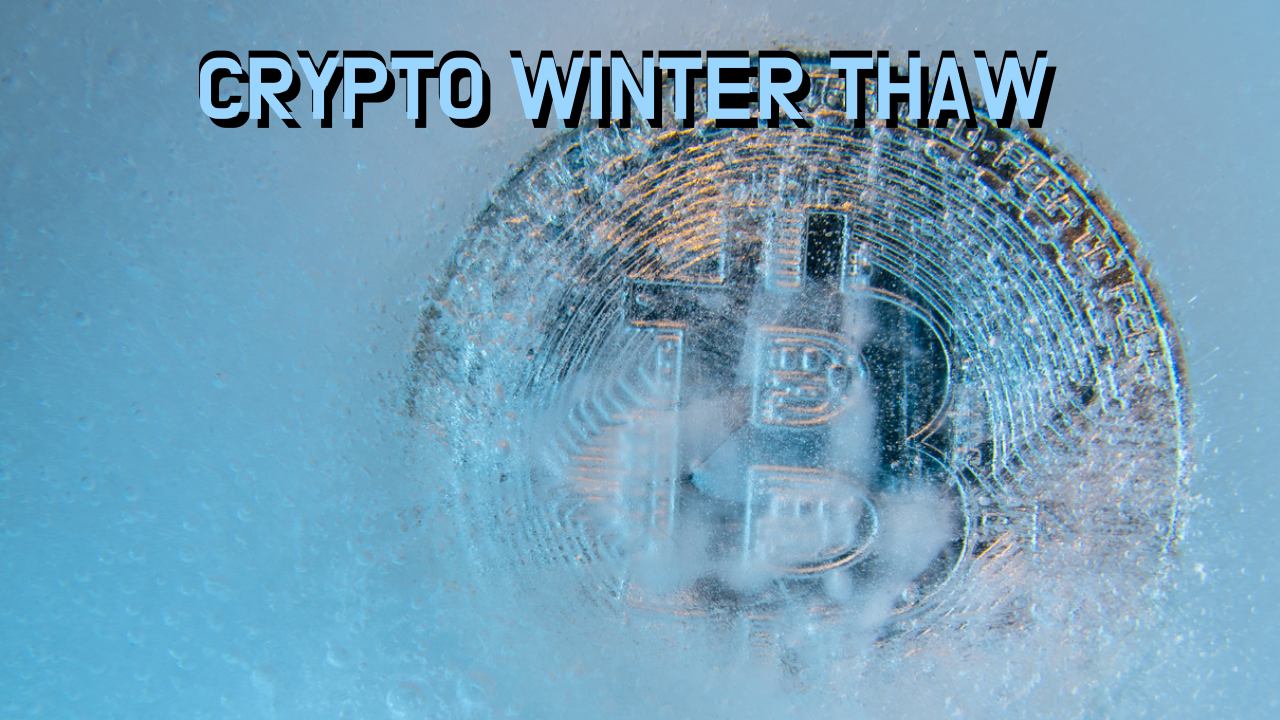
Featured image from iStockPhoto, Charts from TradingView.com