Still, the most used form of price chart remains the traditional Japanese candlestick chart.
This type of candle offers additional information about the open, close, high, and low of each candle.
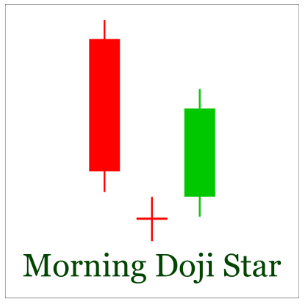
When these candles form in specific sequences or patterns, it can often be a powerful signal about the price action and can help predict future movements or trend changes.


