Reason to trust

How Our News is Made
Strict editorial policy that focuses on accuracy, relevance, and impartiality
Ad discliamer
Morbi pretium leo et nisl aliquam mollis. Quisque arcu lorem, ultricies quis pellentesque nec, ullamcorper eu odio.
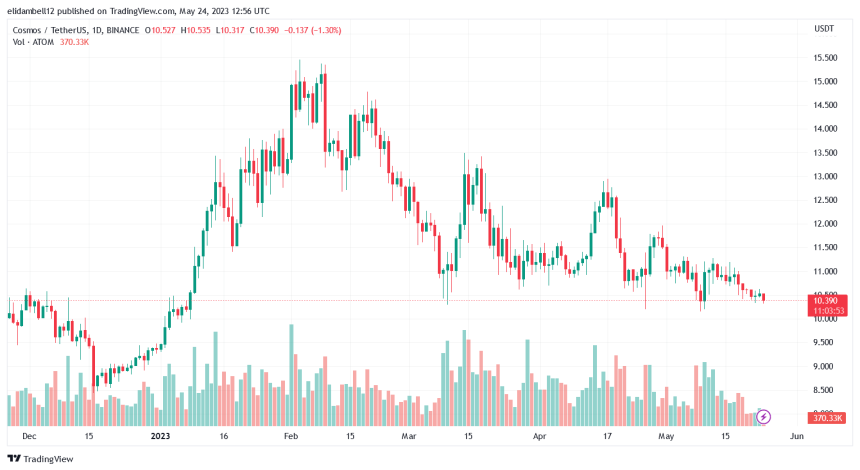
Cosmos (ATOM) experienced a short bullish momentum on May 10, 2023. The asset saw an increase of 10.89% taking its price to a high of $11.2.
However, the bears regained control of the market on May 13 and sent the coin to its current price of $10.40, representing a decrease of 1.12%. From the beginning of May 2023 till date, ATOM has witnessed a price decline of 11.2%, based on its current price.
Bears In Control of Comos (ATOM) Price
The ATOM/USDT daily chart suggests that the market sentiment for Cosmos (ATOM) is predominantly bearish. It also shows a downward price movement dominating and hindering any potential bullish momentum.
Related Reading: Data Suggests Small Holders Will Drive Next Cardano (ADA) Rally
The price of ATOM was influenced negatively by the recent chaotic legal battle with its former growth and strategy chief, Grace Yu.
The news raised negative sentiments among investors and market participants toward Cosmos (ATOM). The Validators even urged Cosmos founder Kwon Jae to close the case against Grace Yu. And this action indicates a level of concern within the Cosmos community.
Negative sentiment towards an asset can influence investor behavior, decreasing demand for ATOM and potentially contributing to downward pressure on its price.
An example of this is that ATOM has been trending down since April 17, suggesting a bearish sentiment. The trendline now serves as a reference for identifying potential resistance levels since the asset has tested it severally.

Cosmos (ATOM) trades between $10.160 and $11.301 support and resistance levels. ATOM breaking through the $10.160 primary support level will confirm the bearish momentum. Afterward, the bears might target the next support level at $8.441.
However, the bulls are trying hard to push the price to the primary resistance level of $11.301 but couldn’t due to the high bearish momentum.
ATOM Technical Analysis
ATOM is trading below its 200-Day and 50-Day Simple Moving Averages (SMA), suggesting a bearish market sentiment.
This level indicates that ATOMs’ recent and long-term price averages are declining, potentially indicating a negative trend and a higher likelihood of further downward price movement.
Related Reading: Meme Coin Season May Be Over As PEPE, SHIB, DOGE, Continue Decline
The Moving Average Convergence/Divergence (MACD) confirms the bearish market sentiment as the asset trades the signal line. It suggests that the short-term moving average moves lower than the longer-term moving average, pointing toward downward momentum.
Meanwhile, the Relative Strength Index (RSI), with a reading of 43.29, suggests a neutral market sentiment.
The indicator shows the price is neither overbought nor oversold. For now, the ATOM price outlook is bearish. But crypto assets are volatile and could deviate from predicted price trends without warnings.
Featured image from Pixabay and chart from Tradingview.com


