Chainlink has showcased its volatility over the past few days, with the price plunging 12% before staging an impressive 13% recovery in less than 24 hours. This rapid rebound has sparked optimism among investors, who view the altcoin’s resilience as a sign of its potential for significant gains in the near term.

Top analyst Jelle shared a technical analysis on X, describing the LINK weekly chart as slowly evolving into a “thing of beauty.” The chart signals growing strength, suggesting that Chainlink could be poised for a substantial move if key price levels are reclaimed.
The coming days will be crucial for LINK, as fresh supply zones are yet to be tested. A successful breakout above current resistance levels could catalyze a massive rally, potentially pushing Chainlink to multi-year highs. However, failure to hold its recent gains could lead to further consolidation or a retrace to test demand zones.
As market sentiment shifts and technical indicators align, Chainlink is catching the attention of traders and long-term holders alike. The stage is set for a potential breakout, and all eyes are on LINK to see if it can capitalize on its momentum and deliver the rally many are anticipating.
Chainlink Prepares for a Rebound After 42% Correction
Chainlink (LINK) has faced a challenging few weeks, with the price plummeting over 42% since mid-December. However, signs are emerging that this steep correction may be nearing its end. Analysts are now speculating that LINK has reached a bottom, as short-term price action hints at bullish momentum.
Top analyst Jelle shared a detailed technical analysis on X, highlighting that LINK’s weekly chart is “slowly turning into a true thing of beauty.” He noted the significance of a painful yet critical retest of a key support level, which LINK has managed to hold firmly. This resilience is boosting confidence among investors and traders that the worst may be over for the altcoin.
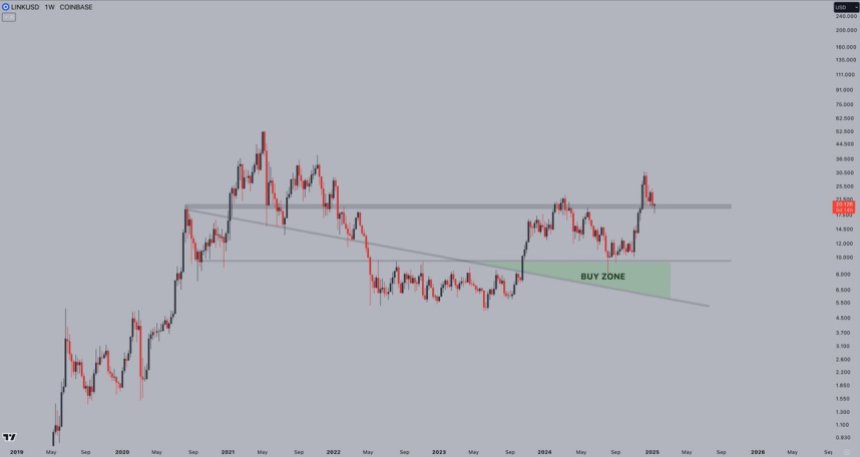
Jelle identified the first key target for LINK at $30, with expectations of new all-time highs following if bullish momentum sustains. For this to materialize, LINK must reclaim crucial levels to break the daily downtrend and establish a bullish structure.

The coming days are critical for Chainlink’s recovery. If LINK successfully holds its support and breaks above short-term resistance levels, it could trigger a rally that many investors are anticipating. A failure to maintain these levels, however, could lead to further consolidation or even a retest of recent lows. The market is watching closely as Chainlink attempts to chart its next big move.
Price Holds Strong: Key Levels To Watch
Chainlink (LINK) is trading at $20 after a volatile Monday, during which the price briefly broke down to the $17 mark before staging a swift recovery within hours. This dramatic rebound has reinvigorated bullish sentiment, with many investors speculating that LINK could be gearing up for its next major move.
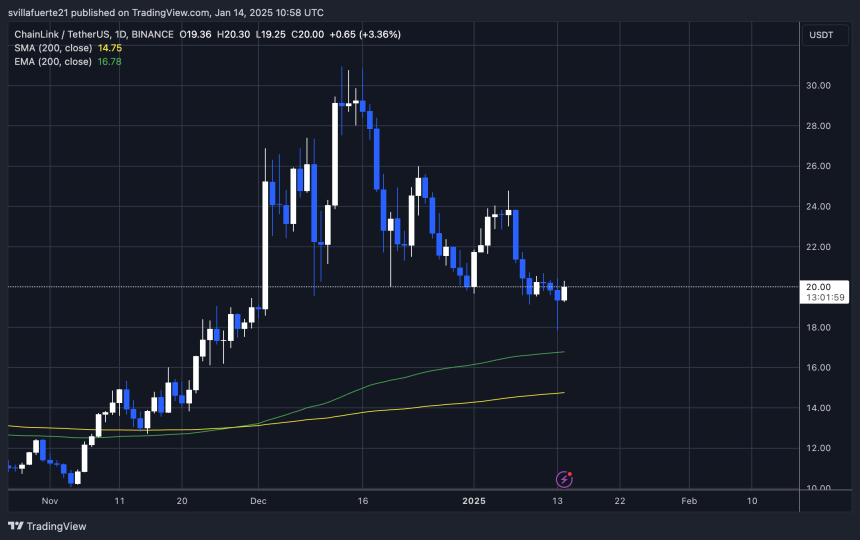
Bulls appear to have gained the upper hand, as the price now flirts with breaking above the $22 level. Successfully reclaiming this level would set the stage for a challenge of the $25 local high, a critical resistance point for LINK’s short-term price action. Analysts believe that flipping these levels into support could act as a springboard for a significant rally, potentially pushing LINK into higher territory.
However, the journey ahead remains uncertain. LINK needs to maintain its momentum to avoid falling back into bearish territory. A failure to break above $22 could result in renewed consolidation or a retest of lower support levels.

For now, all eyes are on Chainlink’s price action as it navigates this pivotal moment. A decisive breakout above the $25 mark could signal the start of a strong bullish trend, reigniting optimism among investors and setting the stage for further gains.
Featured image from Dall-E, chart from TradingView