

The on-chain analytics firm Glassnode has revealed where the next Bitcoin support level could be based on different pricing models.
Bitcoin Is Currently Retesting 1-Year MVRV Z-Score Mean
In a new post on X, the on-chain analytics firm Glassnode has discussed about how BTC has been looking on a couple of pricing models recently. The first of these models is based on the Market Value to Realized Value (MVRV) Z-Score, which compares the market cap of Bitcoin with its realized cap and applies a standard deviation test to pull out the extremes.
The “realized cap” here refers to an on-chain indicator that basically keeps track of the total amount of capital that the holders as a whole have invested into BTC.
As the market cap represents the value that the investors are holding in the present, its comparison against this initial investment in the MVRV Z-Score provides information about the profitability of the userbase.
Now, here is the model shared by the analytics firm, that uses the mean and two standard deviations (SDs) of the 1-year MVRV Z-Score to define Bitcoin price levels:

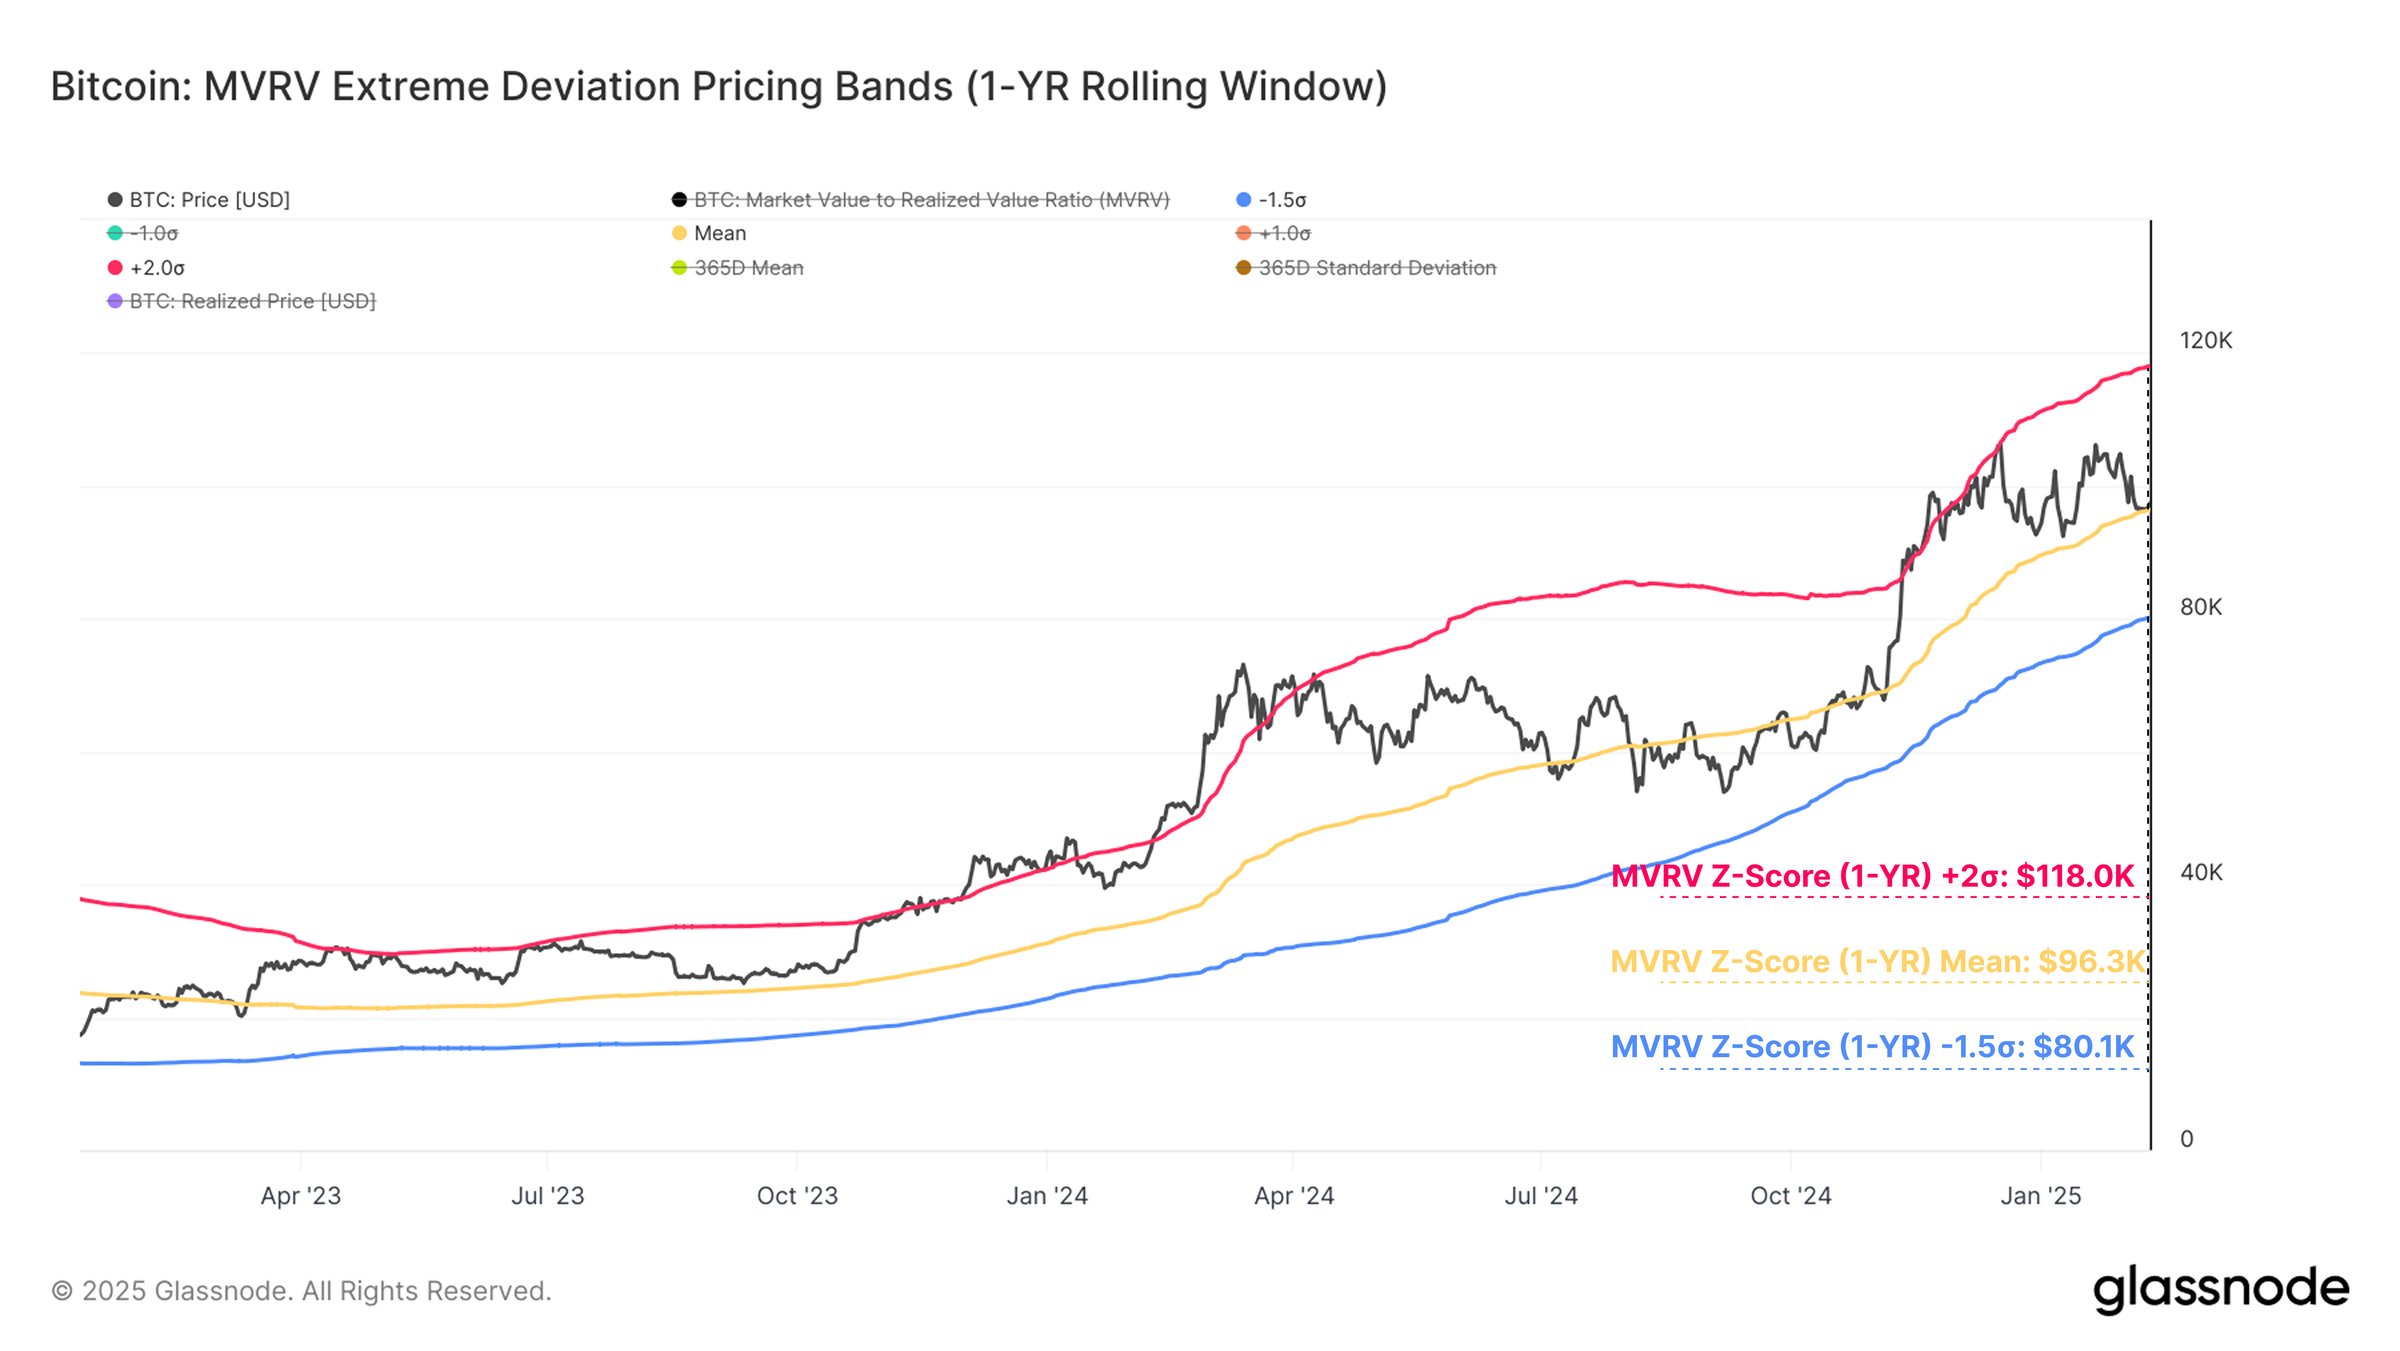
As displayed in the above graph, the mean of the MVRV Z-Score is situated at $96,300 right now. Bitcoin’s spot price has been trading around this mark recently, which suggests the MVRV Z-Score has been equal to its 1-year mean.
So far, BTC has managed to recover back above this mean level each time it has plunged under it recently, but if the line ends up failing, the cryptocurrency might have to search for support elsewhere.
From the chart, it’s visible that the next support level in this model is currently at $80,100. At this price, the 1-year MVRV Z-Score would be -1.5 SD away from its mean.
This isn’t actually the next major on-chain support level that Bitcoin can rely on, however, as this second model shared by the analytics firm has a historically significant line that’s closer.

In the above graph, the average cost basis (formally called the realized price) of the Bitcoin short-term holders is shown. The “short-term holders” (STHs) refer to BTC investors who purchased their coins within the past 155 days.
The realized price of the STHs has often acted as an important support boundary during bullish periods. At present, this level is equivalent to $92,000. As such, before BTC can retest the lower MVRV Z-Score pricing band, it will have to go through this line.
BTC Price
Bitcoin appears to have declined under the 1-year MVRV Z-Score mean today as its price is now trading around $95,400. It remains to be seen whether this is only a temporary deviation or not.
