

An analytics firm has revealed that Bitcoin has historically tended to form tops and bottoms whenever this on-chain indicator spikes.
Bitcoin ‘Trader’ Supply Has Shown An Interesting Pattern With The Price
In a new post on X, the market intelligence platform IntoTheBlock has discussed a pattern that the Bitcoin price appears to have followed in the past to the supply of the “traders.”
The analytics firm defines traders as short-term holders who bought their coins within the past month. Naturally, this market segment would represent the investors who are either new entrants or need more conviction to HODL for any significant period.
Statistically speaking, an investor’s age inversely correlates to their willingness to sell. The longer the holders keep their coins dormant in their wallets, the less likely they become to sell them at any point.
Thus, the traders being referred to here would be part of the market that’s the most likely to participate in selling (whether with the motive of profit-taking after a rally or because of panic after a crash).
Below is the chart shared by IntoTheBlock that shows the trend in the supply held by the investors belonging to this group over the entire history of the cryptocurrency.

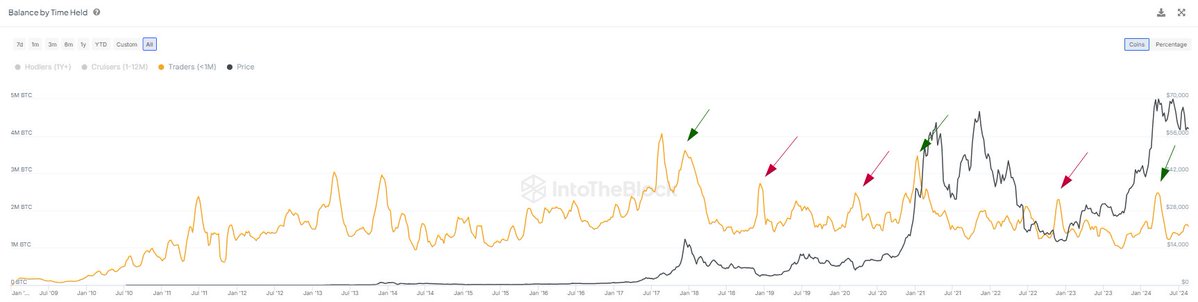
As displayed in the graph, the Bitcoin supply held by the traders had shot up earlier in the year when the asset’s price had marched to its all-time high (ATH), but it has since come back down to low levels.
In the chart, IntoTheBlock has highlighted the previous instances where the combined balance of this cohort showed a similar peak pattern. Such spikes have generally coincided with notable events in the BTC price itself.
“Historically, spikes in these holdings have consistently aligned with market peaks and bottoms, offering valuable signals for market timing,” notes the analytics firm.
The explanation behind this pattern may lie in the fact that any kind of trading activity on the network by any cohort ends up being registered in the supply of this cohort since coins get their age reset back to zero as soon as they become involved in a trade.
Thus, investors are making a lot of moves when the supply of the “traders” suddenly shoots up to high levels. In bull markets, the upward trajectory in the metric can correspond to new demand to absorb the profit-taking from the HODLers.
While in bear markets, the indicator’s spike generally comes from resolute hands participating in accumulation, thus helping the cryptocurrency’s price reach a bottom.
The Bitcoin trader supply has been showing an upward trajectory again recently. Still, the increase has been minimal, suggesting the asset may not be near the top or bottom.
BTC Price
Bitcoin has recently surged, with its price recovering above $64,000.
