

Bitcoin has seen a significant price movement today, reaching a high of $67,803, breaking above a descending falling wedge pattern on the daily chart.
While this breakout has captured attention, Bitcoin is yet to close a daily candle above this resistance, which would confirm the breakout as successful.
Regardless, this development has sparked fresh analyses from prominent crypto commentators, many of whom are now sharing their latest insights on the next target for Bitcoin following this pattern breakout.
Analysts Weigh In On Bitcoin Wedge Pattern Breakout
A CryptoQuant analyst, known by the pseudonym Papi, referred to the falling wedge pattern as the 2024 “nope zone” in a recent post. Papi stated, “2024’s Nope Zone is undefeated. For now. Will this time be different?”


He pointed out that this is the first time Bitcoin has retested the price successfully above the “nope zone” on a four-day chart. The analyst also mentioned that high open interest (OI) and ETF flows showed bullish signals, although net flows on derivative exchanges remained neutral.
“Even if we don’t break out this time, we are getting very close,” Papi added, emphasizing the importance of dollar-cost averaging during this period of consolidation. He also highlighted the support levels at $60,000 and the mid-$50,000 range as strong backstops in case of any pullback.
Road to $90,000?
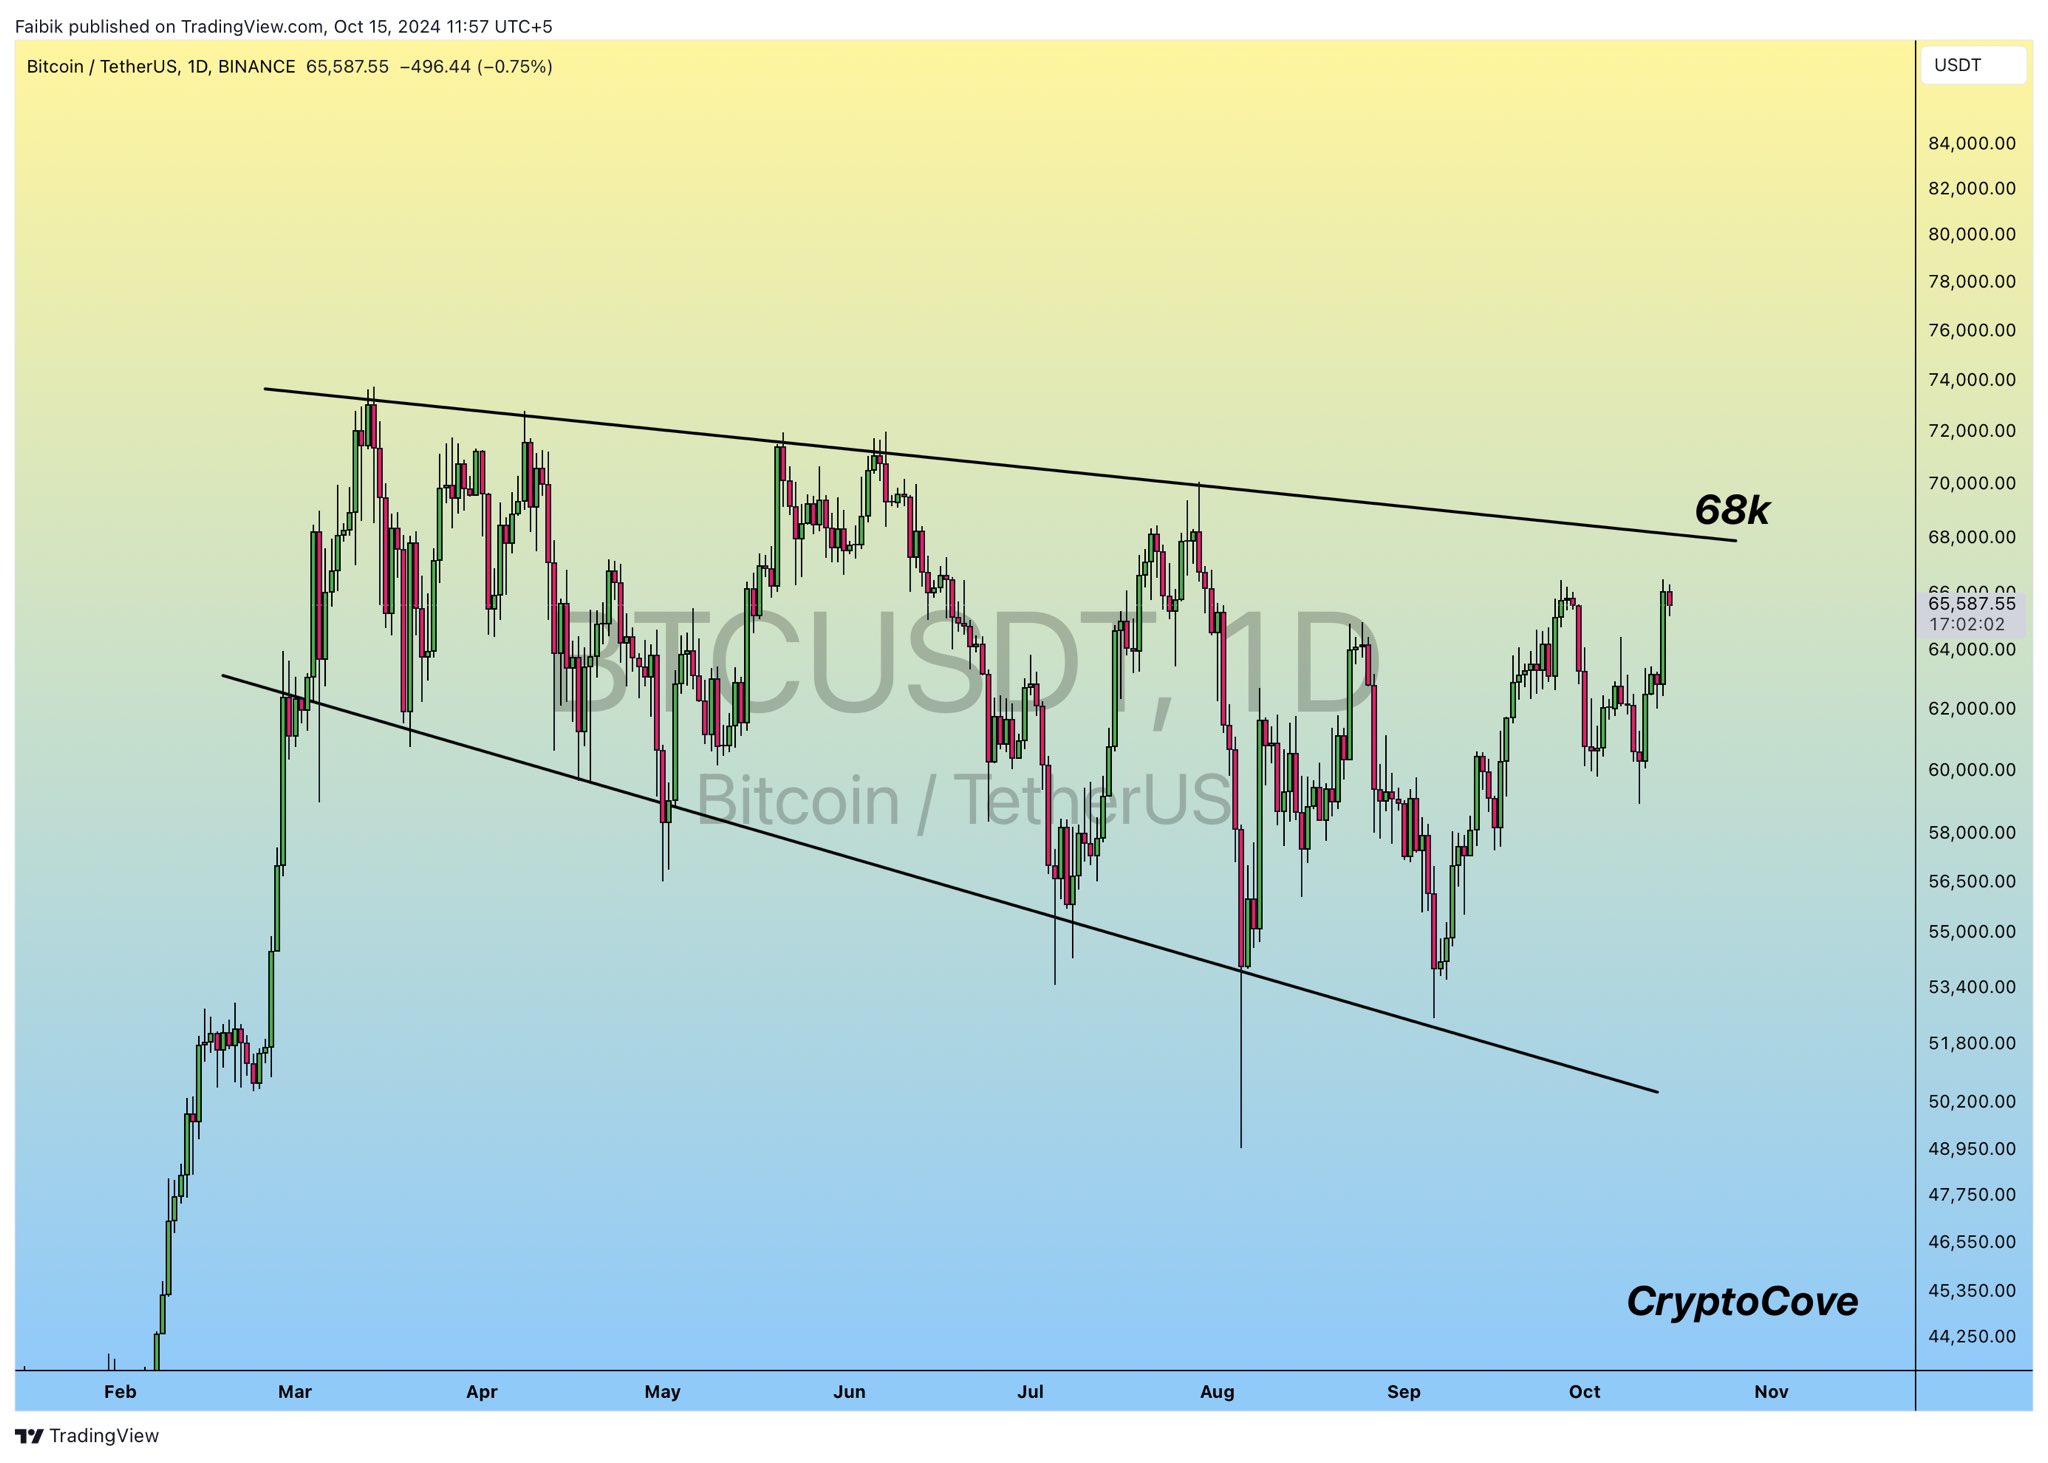
Despite the initial breakout, Bitcoin has faced a minor correction, trading at $66,047, up by 0.2% in the past 24 hours. This small pullback has not deterred analysts from making bullish predictions. Captain Faibik, another well-known crypto analyst, took to X to comment on Bitcoin’s price movement.

He noted, “So far, so good… Bitcoin is once again heading towards the $68k crucial resistance. A successful wedge breakout could send Bitcoin to $88k-$90k in November.” Faibik remains optimistic, anticipating a larger move upwards if BTC can clear this key resistance level.

Similarly, another prominent analyst, RektCapital, shared his perspective on the current price action. RektCapital pointed to Bitcoin’s historical rejections from the downtrending channel top, noting that previous pullbacks were progressively deeper.
The analyst added: “This current rejection is Bitcoin’s first chance to show that this downtrending channel top resistance is weakening as a point of rejection.”
Here are historical rejections from the Downtrending Channel Top (red)
From mid-March, the rejections have resulted in progressively deeper pullbacks:
Initially -17% followed by -22% then -26% then -29%
This current rejection is Bitcoin’s first chance to show that this… https://t.co/wXePIvVs5D pic.twitter.com/k2lMLje0yO
— Rekt Capital (@rektcapital) October 15, 2024
Featured image created with DALL-E, Chart from TradingView