
Reason to trust
How Our News is Made
Strict editorial policy that focuses on accuracy, relevance, and impartiality
Ad discliamer
Morbi pretium leo et nisl aliquam mollis. Quisque arcu lorem, ultricies quis pellentesque nec, ullamcorper eu odio.
Ripple’s token price is consolidating above $0.620 against the US Dollar. XRP price might start a decent increase if there is a clear move above $0.650.
- Ripple’s token price is moving lower from the $0.6650 resistance against the US dollar.
- The price is now trading below $0.65 and the 100 simple moving average (4 hours).
- There is a key bearish trend line forming with resistance near $0.628 on the 4-hour chart of the XRP/USD pair (data source from Kraken).
- The pair might continue to decline if there is no move above $0.63 and $0.65.
Ripple’s Token Price Dips Again
After a recovery wave, Ripple’s XRP struggled to clear the $0.6650 resistance against the US Dollar. A high was formed near $0.6654 before the price started a fresh decline, similar to Bitcoin and Ethereum.
There was a move below the $0.650 pivot level. The price declined below the 50% Fib retracement level of the upward move from the $0.5926 swing low to the $0.6654 high. The price even declined below the $0.635 support zone.
XRP is now trading below $0.65 and the 100 simple moving average (4 hours). There is also a key bearish trend line forming with resistance near $0.628 on the 4-hour chart of the XRP/USD pair.
Initial resistance on the upside is near the $0.628 zone and the trend line. The next major resistance is near the $0.650 level and the 100 simple moving average (4 hours). The main resistance is now forming near the $0.6650 zone.
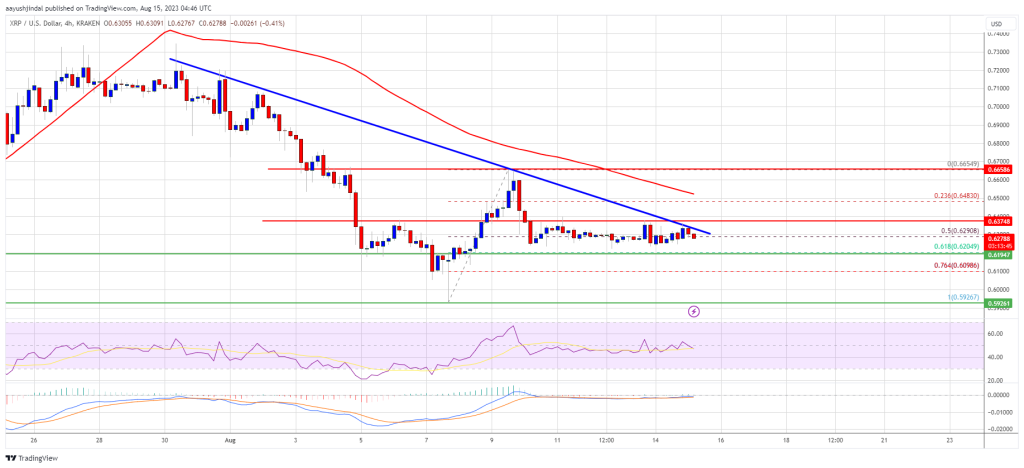
Source: XRPUSD on TradingView.com
A successful break above the $0.6650 resistance level might send the price toward the $0.70 resistance. Any more gains might call for a test of the $0.720 resistance.
More Losses in XRP?
If ripple fails to clear the $0.650 resistance zone, it could start another decline. Initial support on the downside is near the $0.620 zone and the 61.8% Fib retracement level of the upward move from the $0.5926 swing low to the $0.6654 high.
The next major support is near $0.60. If there is a downside break and a close below the $0.60 level, XRP’s price could extend losses. In the stated case, the price could retest the $0.585 support zone.
Technical Indicators
4-Hours MACD – The MACD for XRP/USD is now losing pace in the bearish zone.
4-Hours RSI (Relative Strength Index) – The RSI for XRP/USD is now below the 50 level.
Major Support Levels – $0.62, $0.60, and $0.585.
Major Resistance Levels – $0.628, $0.650, and $0.665.