Reason to trust
How Our News is Made
Strict editorial policy that focuses on accuracy, relevance, and impartiality
Ad discliamer
Morbi pretium leo et nisl aliquam mollis. Quisque arcu lorem, ultricies quis pellentesque nec, ullamcorper eu odio.
XRP price is moving lower from the $0.732 resistance. The price is now at risk of more losses toward the $0.550 support before the bulls take a stand.
- XRP started a downside correction below $0.638 and $0.612.
- The price is now trading below $0.625 and the 100 simple moving average (4 hours).
- There is a key declining channel forming with resistance near $0.622 on the 4-hour chart of the XRP/USD pair (data source from Kraken).
- The pair dive toward the $0.550 support before the bulls take a stand.
XRP Price Turns Red
In the past few days, XRP saw a steady decline from the $0.740 zone. There was a move below the $0.685 and $0.638 support levels. The price even dived below the $0.612 support, underperforming Bitcoin and Ethereum.
There was a recovery wave from $0.572, but the bears were active near $0.638. A high was formed near $0.6385 and the price is now moving lower. There was a break below the 50% Fib retracement level of the upward move from the $0.5723 swing low to the $0.6385 high.
XRP is now trading below $0.625 and the 100 simple moving average (4 hours). There is also a key declining channel forming with resistance near $0.622 on the 4-hour chart.
On the upside, immediate resistance is near the $0.615 level. The first major resistance is near the $0.622 zone or the 100 simple moving average (4 hours) or the channel upper zone. A close above the $0.622 resistance zone could spark a steady increase.
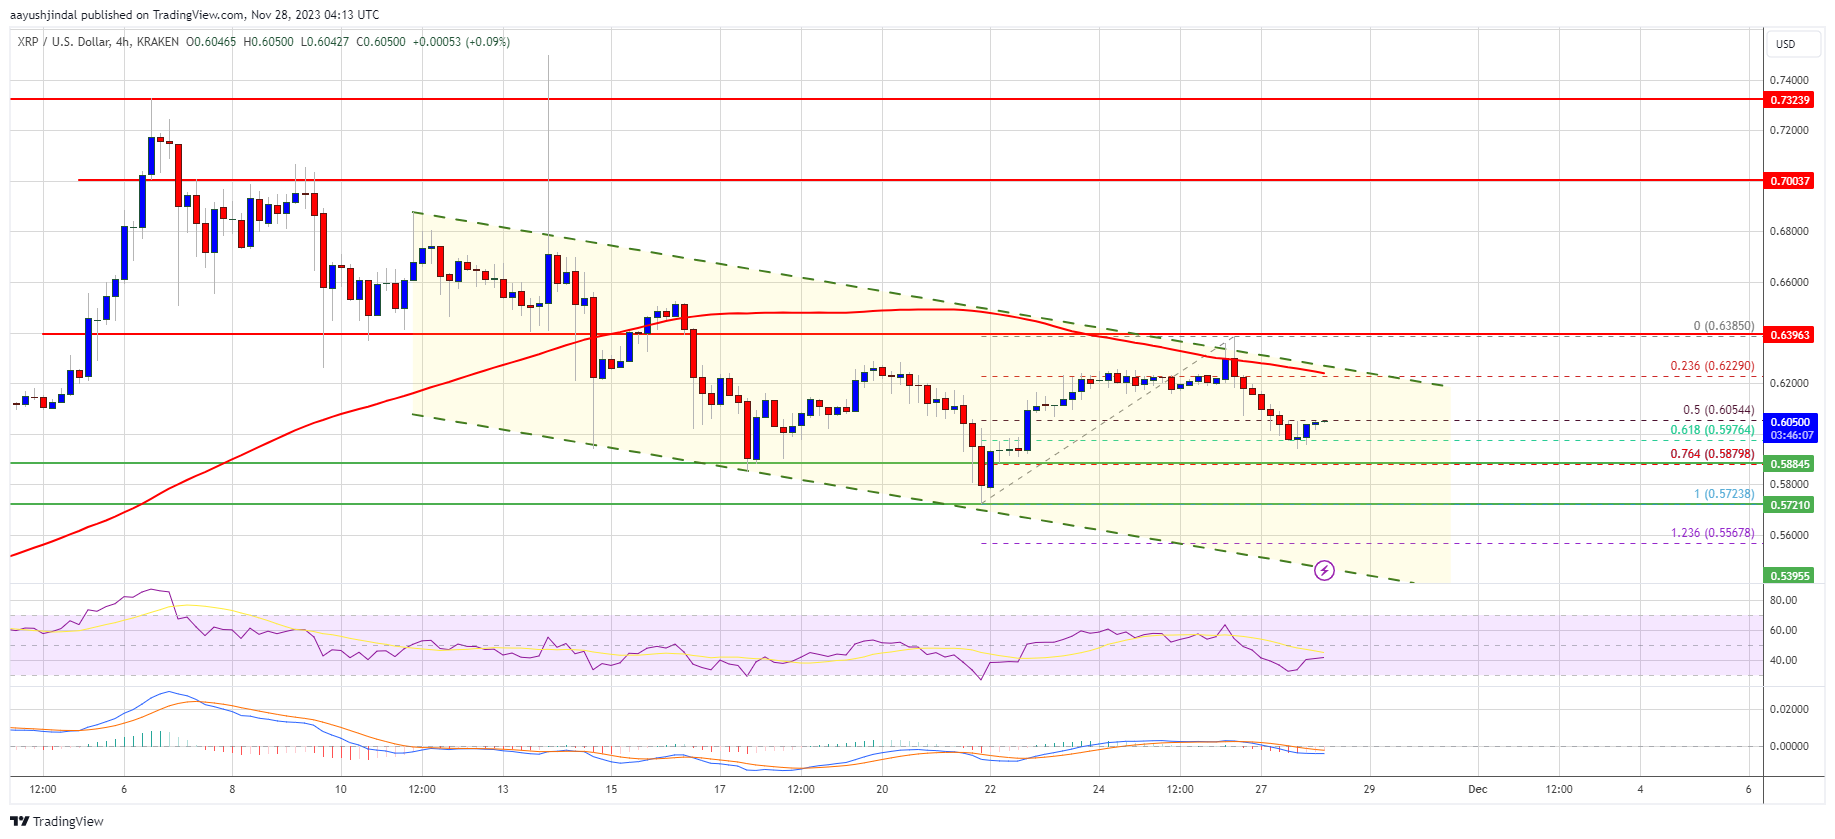
Source: XRPUSD on TradingView.com
The next key resistance is near $0.638. If the bulls remain in action above the $0.638 resistance level, there could be a rally toward the $0.700 resistance. Any more gains might send XRP toward the $0.720 resistance.
More Downsides?
If XRP fails to clear the $0.622 resistance zone, it could start a fresh decline. Initial support on the downside is near the $0.588 zone.
The next major support is at $0.572. If there is a downside break and a close below the $0.572 level, XRP price might accelerate lower. In the stated case, the price could retest the $0.540 support zone.
Technical Indicators
4-Hours MACD – The MACD for XRP/USD is now gaining pace in the bearish zone.
4-Hours RSI (Relative Strength Index) – The RSI for XRP/USD is now below the 50 level.
Major Support Levels – $0.588, $0.572, and $0.540.
Major Resistance Levels – $0.622, $0.638, and $0.700.