
Reason to trust
How Our News is Made
Strict editorial policy that focuses on accuracy, relevance, and impartiality
Ad discliamer
Morbi pretium leo et nisl aliquam mollis. Quisque arcu lorem, ultricies quis pellentesque nec, ullamcorper eu odio.
XRP price is correcting gains from the $0.585 resistance against the US Dollar. The bulls are active near $0.550 and might soon initiate a new rally.
- XRP started a strong increase above the $0.55 resistance.
- The price is now trading above $0.525 and the 100 simple moving average (4 hours).
- There is a key bullish trend line forming with support near $0.5520 on the 4-hour chart of the XRP/USD pair (data source from Kraken).
- The pair might correct further lower, but the bulls could remain active near $0.5320.
XRP Price Holds Ground
After forming a base above the $0.478 level, XRP started a fresh increase. The recent pump in Bitcoin and Ethereum also dragged XRP higher. The price gained pace after it broke the $0.525 resistance.
There was a move above the $0.550 and $0.565 resistance levels. Finally, it traded to a new multi-week high at $0.5859. Recently, there was a downside correction below the $0.575 level. The price declined below the 23.6% Fib retracement level of the upward move from the $0.4778 swing low to the $0.5859 high.
The price is now trading above $0.525 and the 100 simple moving average (4 hours). There is also a key bullish trend line forming with support near $0.5520 on the 4-hour chart of the XRP/USD pair.
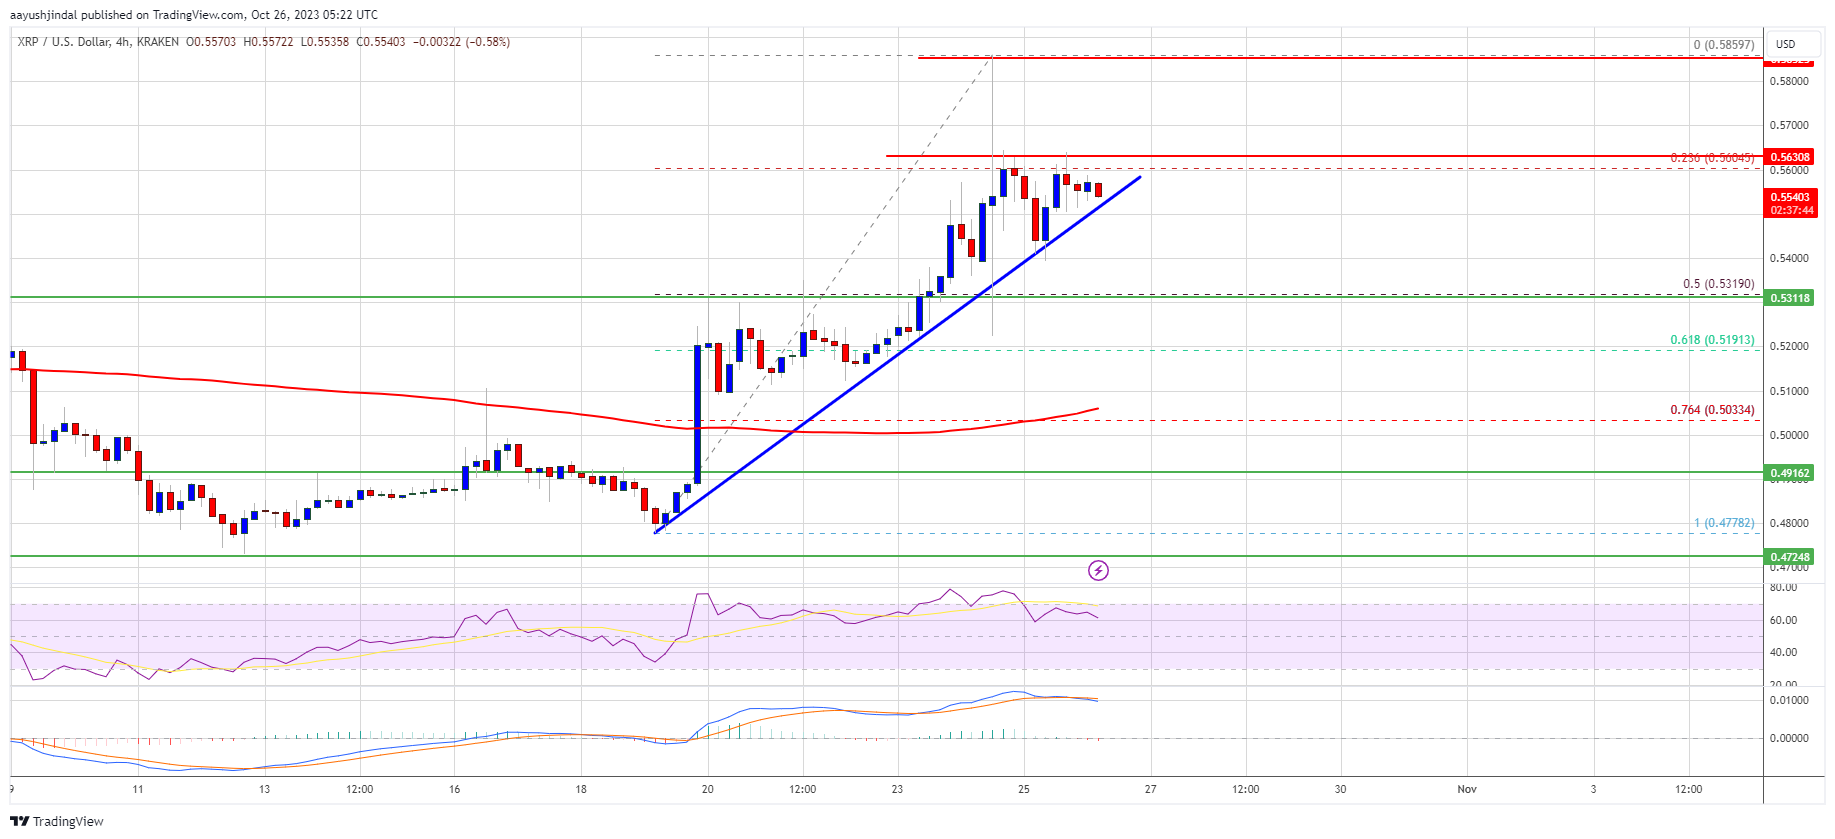
Source: XRPUSD on TradingView.com
On the upside, immediate resistance is near the $0.563 level. A close above the $0.563 level could send the price toward the $0.585 resistance. If the bulls remain in action above the $0.585 resistance level, there could be a drift toward the $0.620 resistance. Any more gains might send XRP toward the $0.645 resistance.
Are Dips Limited?
If XRP fails to clear the $0.563 resistance zone, it could continue to move down. Initial support on the downside is near the $0.5520 zone and the trend line.
The next major support is at $0.532 or the 50% Fib retracement level of the upward move from the $0.4778 swing low to the $0.5859 high. If there is a downside break and a close below the $0.532 level, The price might accelerate lower. In the stated case, the price could retest the $0.505 support zone.
Technical Indicators
4-Hours MACD – The MACD for XRP/USD is now losing pace in the bullish zone.
4-Hours RSI (Relative Strength Index) – The RSI for XRP/USD is now above the 50 level.
Major Support Levels – $0.552, $0.532, and $0.505.
Major Resistance Levels – $0.563, $0.585, and $0.620.