Reason to trust
How Our News is Made
Strict editorial policy that focuses on accuracy, relevance, and impartiality
Ad discliamer
Morbi pretium leo et nisl aliquam mollis. Quisque arcu lorem, ultricies quis pellentesque nec, ullamcorper eu odio.
XRP price is moving higher from the $2.40 support zone. The price is showing positive signs and might gain bullish momentum above $2.60.
- XRP price started a decent upward move from the $2.400 zone.
- The price is now trading above $2.50 and the 100-hourly Simple Moving Average.
- There is a key bullish trend line forming with support at $2.40 on the hourly chart of the XRP/USD pair (data source from Kraken).
- The pair might start a fresh increase if it clears the $2.60 resistance zone.
XRP Price Gains Traction
XRP price managed to stay above the $2.40 support and remained in a positive zone, unlike Bitcoin and Ethereum. A base was formed, and the price started a decent upward move above the $2.42 and $2.45 levels.
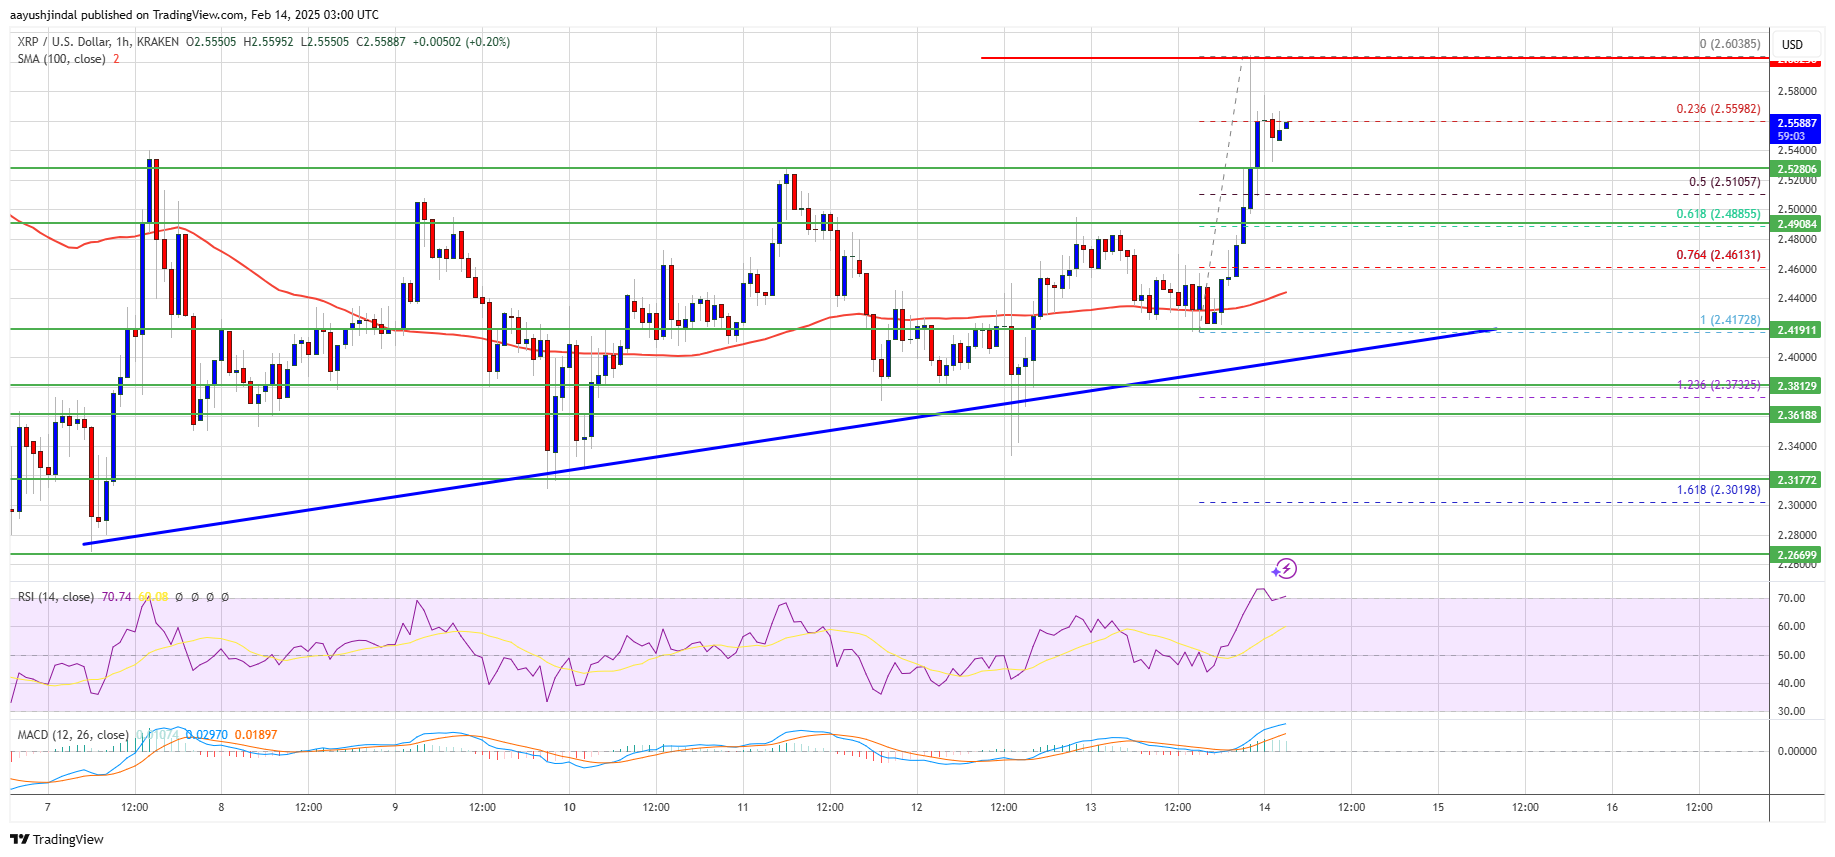
The price surpassed the first key barrier at $2.50. It tested the next hurdle at $2.60. A high was formed at $2.603 and the price is now consolidating gains. There was a minor move below $2.55. The price dipped below the 23.6% Fib retracement level of the upward move from the $2.417 swing low to the $2.603 high.
The current price action is positive. There is also a key bullish trend line forming with support at $2.40 on the hourly chart of the XRP/USD pair.
The price is now trading above $2.540 and the 100-hourly Simple Moving Average. On the upside, the price might face resistance near the $2.580 level. The first major resistance is near the $2.60 level. The next resistance is $2.720. A clear move above the $2.720 resistance might send the price toward the $2.80 resistance.
Any more gains might send the price toward the $2.840 resistance or even $2.920 in the near term. The next major hurdle for the bulls might be $3.00.
Another Decline?
If XRP fails to clear the $2.60 resistance zone, it could start another decline. Initial support on the downside is near the $2.48 level or the 61.8% Fib retracement level of the upward move from the $2.417 swing low to the $2.603 high. The next major support is near the $2.420 level and the trend line.
If there is a downside break and a close below the $2.420 level, the price might continue to decline toward the $2.320 support. The next major support sits near the $2.20 zone.
Technical Indicators
Hourly MACD – The MACD for XRP/USD is now gaining pace in the bullish zone.
Hourly RSI (Relative Strength Index) – The RSI for XRP/USD is now above the 50 level.
Major Support Levels – $2.480 and $2.420.
Major Resistance Levels – $2.60 and $2.720.