Reason to trust
How Our News is Made
Strict editorial policy that focuses on accuracy, relevance, and impartiality
Ad discliamer
Morbi pretium leo et nisl aliquam mollis. Quisque arcu lorem, ultricies quis pellentesque nec, ullamcorper eu odio.
Ripple started a major decline below the $0.4200 and $0.4000 support levels against the US Dollar. XRP price is gaining momentum, but approaching the key 100-day simple moving average and $0.3200.
- Ripple started a strong decline from well above $0.5000 against the US dollar after SEC’s threat.
- The price is now trading well below $0.4000, and approaching the 100-day simple moving average.
- There was a break below a major declining channel with support near $0.4000 on the daily chart of the XRP/USD pair (data source from Kraken).
- The pair is likely to find a strong buying interest near the $0.3250 and $0.3150 levels.
Ripple’s XRP Price is Down 25%
After SEC’s threat, ripple’s XRP price started a strong decline from well above the $0.5000 level. The price is down over 25% and it broke many supports such as $0.4500 and $0.4000.
The price even settled below $0.4000 to move further into a bearish zone. There was a break below the 50% Fib retracement level of the main upward move from the $0.2270 swing low to $0.7853 high. Moreover, there was a break below a major declining channel with support near $0.4000 on the daily chart of the XRP/USD pair.
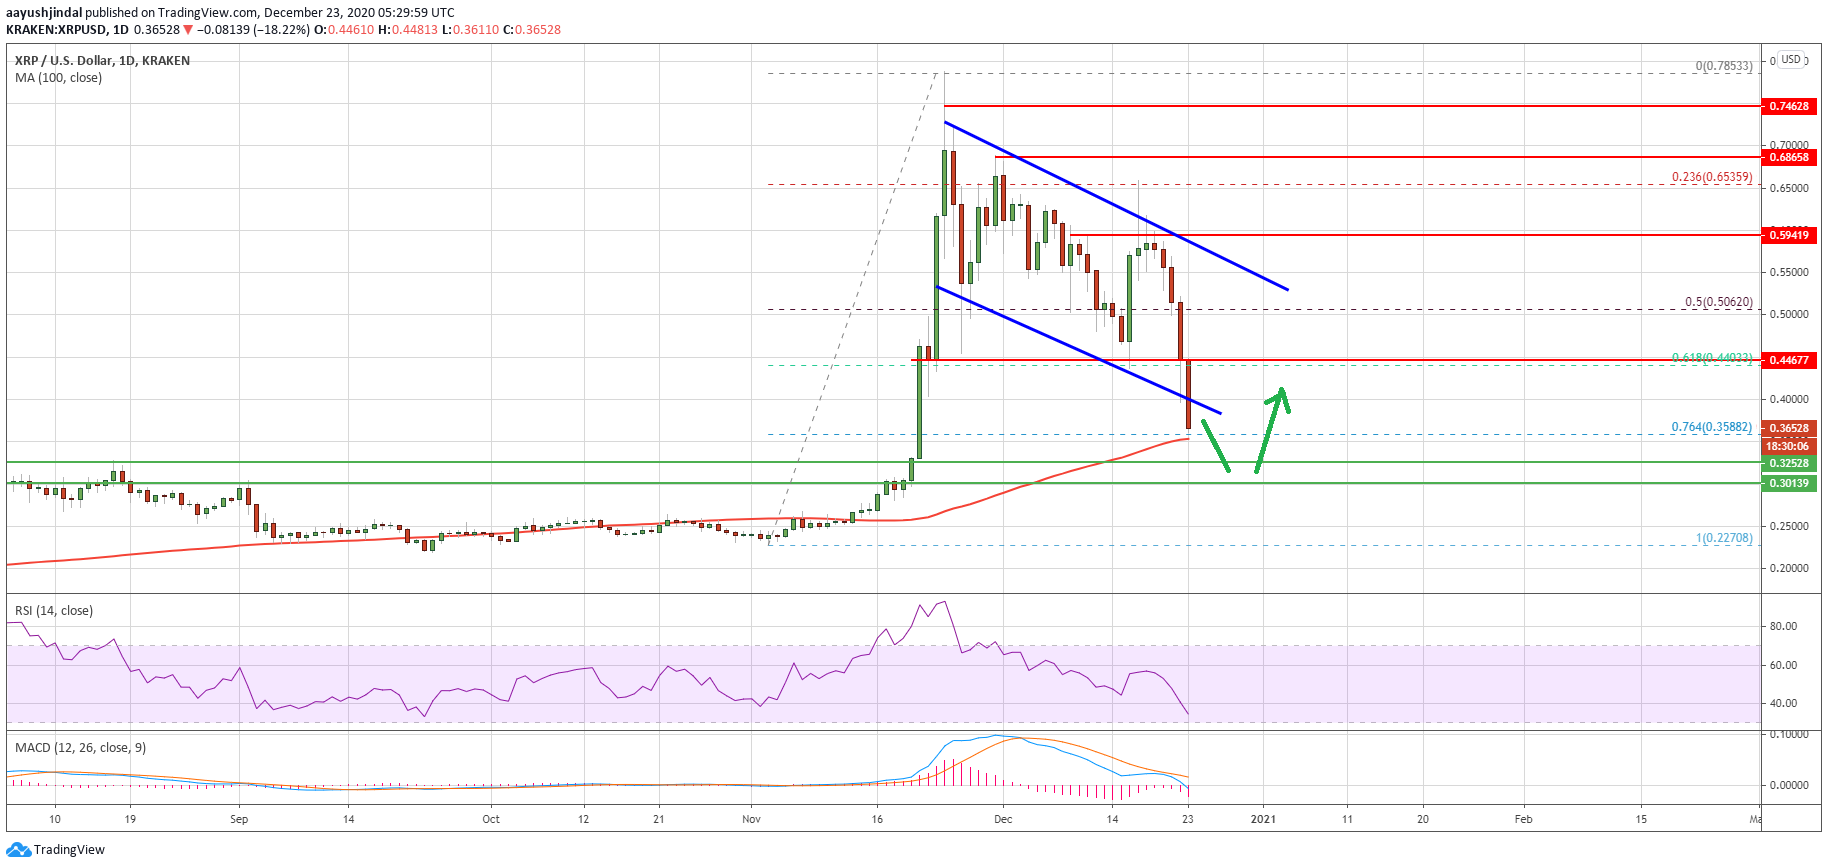
Source: XRPUSD on TradingView.com
XRP price is now trading well below the $0.3800 level. It is now approaching the $0.3400 support zone and the 100-day simple moving average.
The 76.4% Fib retracement level of the main upward move from the $0.2270 swing low to $0.7853 high is also near the $0.3580 level. The next major support is near the $0.3250 level, followed by $0.3000.
A close below the $0.3000 support zone could easily drift the market towards the $0.2650 and $0.2500 support levels in the coming days.
Upsides Capped in XRP?
If ripple starts a recovery wave, it could face a lot of hurdles, starting with the broken channel trend line at $0.3850. The first major resistance for the bulls is near the $0.4000 level.
The main resistance is now forming near the $0.4450 level. A close above the $0.4000 and $0.4500 levels could pull the price out of the bearish zone. If not, it is likely to extend losses below $0.3500.
Technical Indicators
Daily MACD – The MACD for XRP/USD is gaining momentum in the bearish zone.
Daily RSI (Relative Strength Index) – The RSI for XRP/USD is now well below the 50 level.
Major Support Levels – $0.3250, $0.3000 and $0.2500.
Major Resistance Levels – $0.3850, $0.4000 and $0.4500.