Reason to trust
How Our News is Made
Strict editorial policy that focuses on accuracy, relevance, and impartiality
Ad discliamer
Morbi pretium leo et nisl aliquam mollis. Quisque arcu lorem, ultricies quis pellentesque nec, ullamcorper eu odio.
Ripple is struggling to clear the $0.5800 resistance against the US Dollar. XRP price is showing bearish signs and it could accelerate lower below $0.5420.
- Ripple topped just above the $0.6000 level before starting a fresh decline against the US dollar.
- The price is now trading well below the $0.5680 support and the 100 hourly simple moving average.
- There is a key bearish trend line forming with resistance near $0.5800 on the hourly chart of the XRP/USD pair (data source from Kraken).
- The pair is likely to continue lower if there is a clear break below $0.5500 and $0.5420.
Ripple Price is Showing Bearish Signs
In the past 2-3 sessions, there were bearish moves in bitcoin, Ethereum, and ripple against the US Dollar. XRP price formed a high near the $0.6059 before it started a fresh decline.
There was a clear break below the $0.5800 and $0.5750 support levels. There is also a key bearish trend line forming with resistance near $0.5800 on the hourly chart of the XRP/USD pair. The pair even traded below the $0.5650 support and settled well below the 100 hourly simple moving average.
It spiked below the 50% Fib retracement level of the upward move from the $0.5024 swing low to $0.6059 high. An immediate support on the downside is near the $0.550 level. The first key support is near the $0.5420 level. It is close to the 61.8% Fib retracement level of the upward move from the $0.5024 swing low to $0.6059 high.
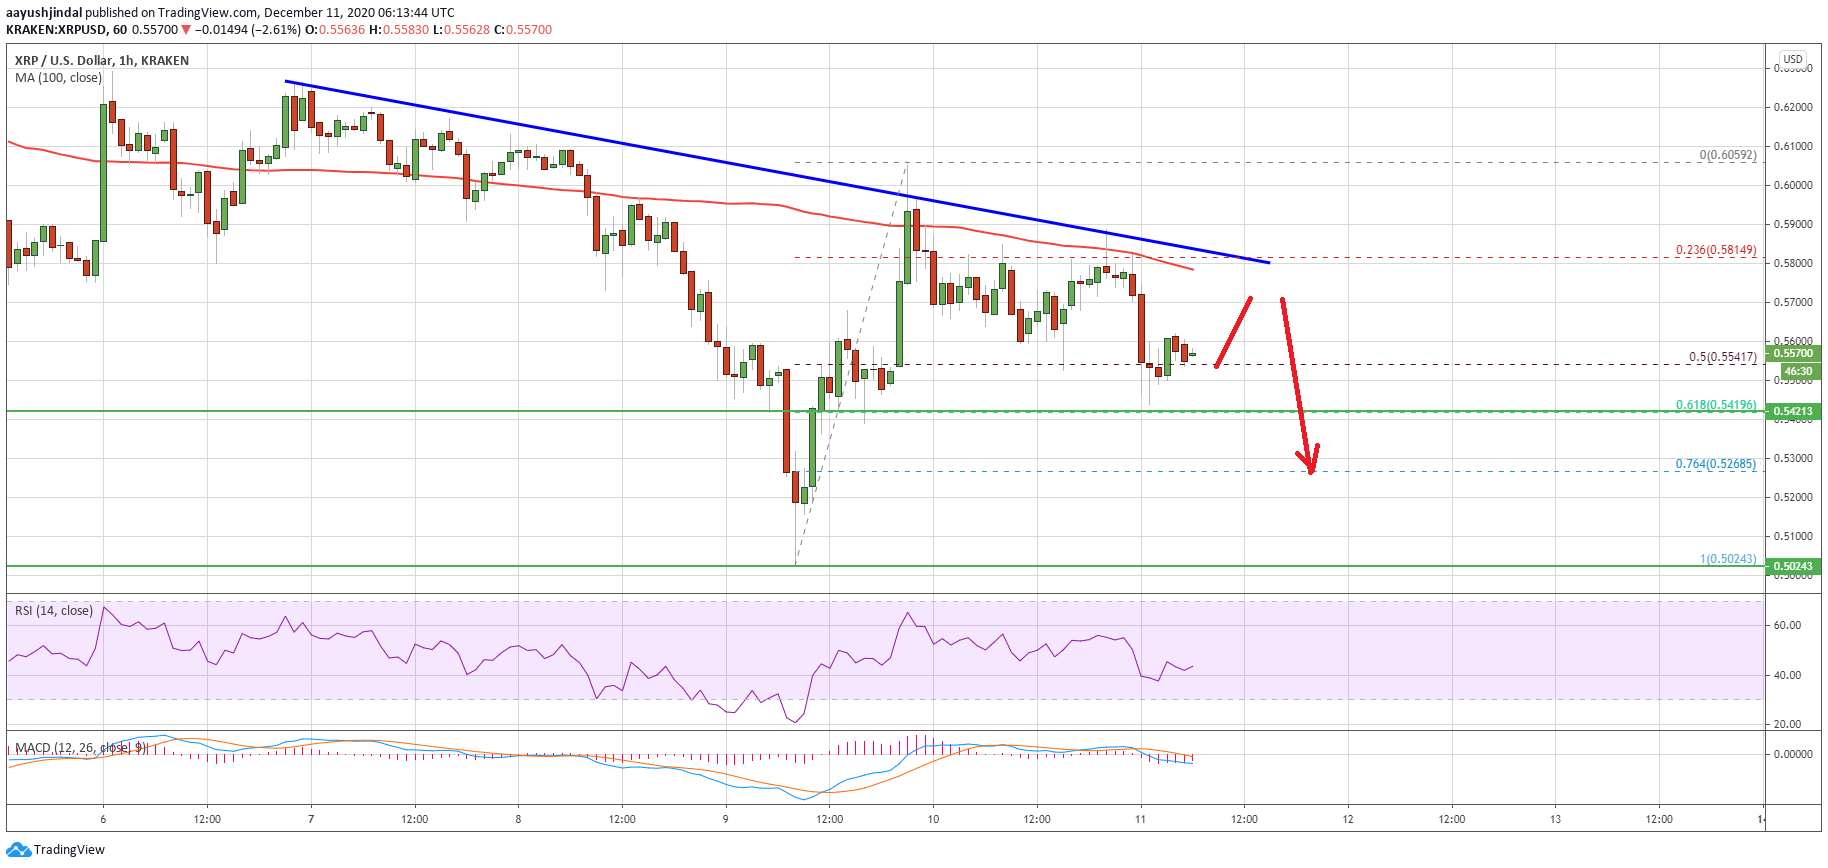
Source: XRPUSD on TradingView.com
A successful close below the $0.5500 and $0.5420 support levels may perhaps start a fresh decline in the coming sessions. In the stated case, there is a risk of a drop towards the $0.5200 support or even $0.5100.
Upsides Capped in XRP?
If there is no downside break in ripple below the $0.5420 support, it could start a decent rise. An initial resistance on the upside is near the $0.5650 level. The first major resistance is near the $0.5720 level.
The main resistance is forming near the bearish trend line, $0.5800, and the 100 hourly simple moving average. A close above the $0.5800 level could start a strong increase towards the $0.6000 and $0.6120 levels in the near term.
Technical Indicators
Hourly MACD – The MACD for XRP/USD is gaining momentum in the bearish zone.
Hourly RSI (Relative Strength Index) – The RSI for XRP/USD is currently well below the 50 level.
Major Support Levels – $0.5500, $0.5420 and $0.5200.
Major Resistance Levels – $0.5650, $0.5700 and $0.5800.