
Reason to trust
How Our News is Made
Strict editorial policy that focuses on accuracy, relevance, and impartiality
Ad discliamer
Morbi pretium leo et nisl aliquam mollis. Quisque arcu lorem, ultricies quis pellentesque nec, ullamcorper eu odio.
Tron price is up over 4% from lows and showing positive signs above $0.062 against the US Dollar. TRX could outperform bitcoin and rise further towards $0.075.
- Tron price is trading in a positive zone well above the $0.0620 pivot level against the US dollar.
- The price is showing positive signs above $0.062 and the 100 simple moving average (4-hours).
- There is a major bullish trend line forming with support near $0.0630 on the 4-hours chart of the TRX/USD pair (data source from Kraken).
- The pair is likely to continue higher if it clears the $0.0668 resistance level.
Tron Price Signals Uptrend
In the past few days, tron price remained strong above the $0.0600 level against the US Dollar, outperforming bitcoin and ethereum. TRX gained pace for a clear move above the $0.062 resistance and the 100 simple moving average (4-hours).
The last swing low was formed at $0.0619 before there was a fresh increase. There was a clear move above the 23.6% Fib retracement level of the downward move from the $0.0717 swing high to $0.0619 low.
Trx price is now above $0.064 and the 100 simple moving average (4-hours). There is also a major bullish trend line forming with support near $0.0630 on the 4-hours chart of the TRX/USD pair. On the upside, an initial resistance is near the $0.0668 level. It is close to the 50% Fib retracement level of the downward move from the $0.0717 swing high to $0.0619 low.
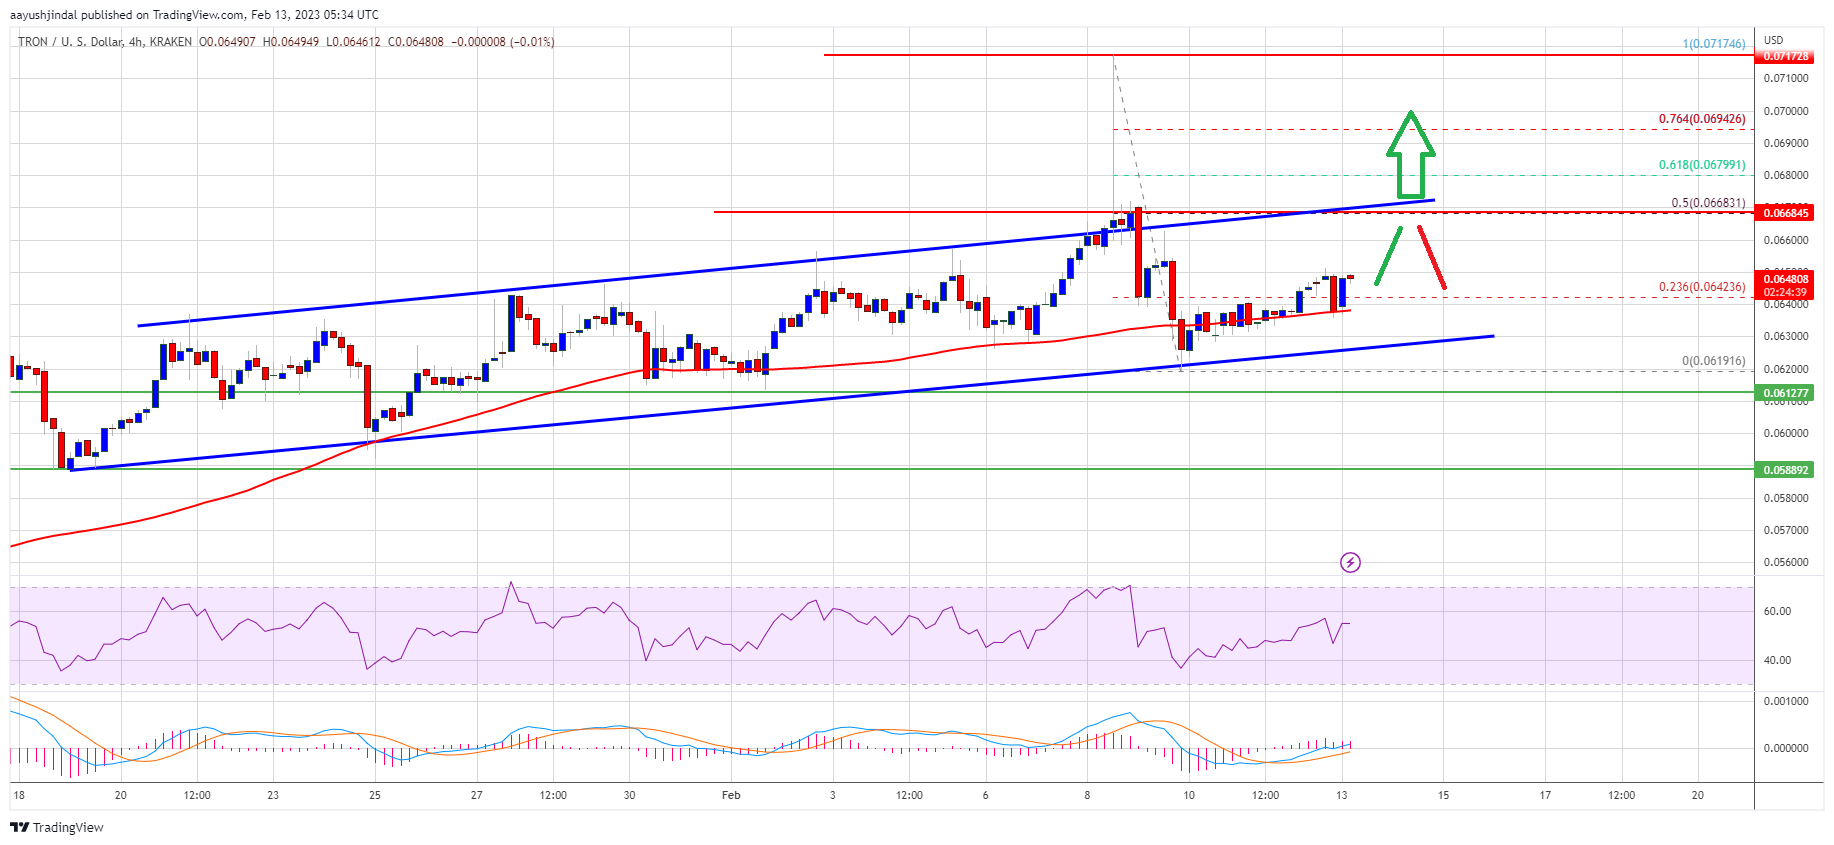
Source: TRXUSD on TradingView.com
The next major resistance is near the $0.0680 level, above which the bulls are likely to aim a larger increase towards the key $0.0720 zone in the coming sessions. Any more gains could set the pace for a move towards the $0.075 level.
Dips Likely to be Limited in TRX
If TRX price fails to clear the $0.0668 barrier, it could correct lower. An initial support on the downside is near the $0.0640 zone and the 100 simple moving average (4-hours).
The next major support is near the $0.0630 level and the channel trend line. The main support is $0.0612, below which there is a risk of a move towards the $0.060 support.
Technical Indicators
4-hours MACD – The MACD for TRX/USD is gaining momentum in the bullish zone.
4-hours RSI (Relative Strength Index) – The RSI for TRX/USD is currently above the 50 level.
Major Support Levels – $0.0640, $0.0630 and $0.0612.
Major Resistance Levels – $0.0668, $0.0680 and $0.0720.