
Reason to trust
How Our News is Made
Strict editorial policy that focuses on accuracy, relevance, and impartiality
Ad discliamer
Morbi pretium leo et nisl aliquam mollis. Quisque arcu lorem, ultricies quis pellentesque nec, ullamcorper eu odio.
Solana is slowly moving higher above the $20 resistance against the US Dollar. SOL price could rally if there is a clear move above the $22.80 resistance.
- Sol price found support near $16 and started a fresh increase against the US Dollar.
- The price is now trading above $20 and the 100 simple moving average (4-hours).
- There was a break above a major bearish trend line with resistance near $18.60 on the 4-hours chart of the SOL/USD pair (data source from Kraken).
- The pair could rise further if it clears the $21.60 and $22.80 resistance levels.
Solana Price Reclaims $20
This past week, solana price found support near the $16 zone. The price formed a base and started a decent increase above the $18 resistance, similar to bitcoin and ethereum.
There was a steady increase above the $18 level. Besides, there was a break above a major bearish trend line with resistance near $18.60 on the 4-hours chart of the SOL/USD pair. The pair is now trading above $20 and the 100 simple moving average (4-hours).
On the upside, an immediate resistance is near the $21.55 level. It is near the 50% Fib retracement level of the downward move from the $27.09 swing high to $16.00 low.
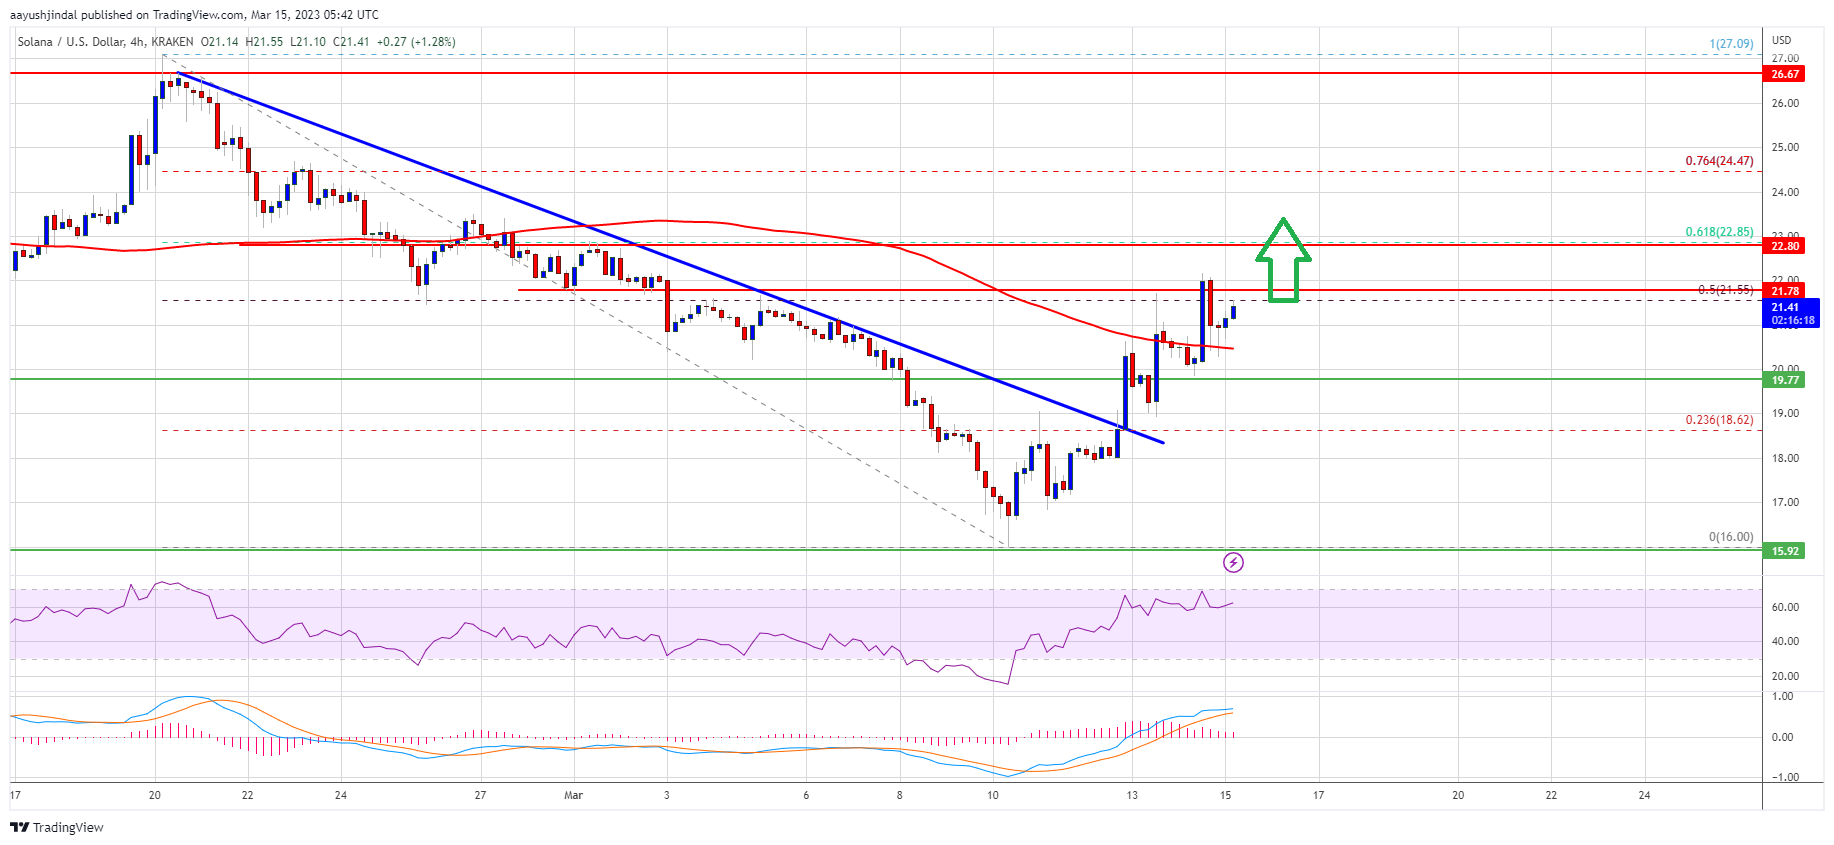
Source: SOLUSD on TradingView.com
The next major resistance is near the $22.80 level. It is near the 61.8% Fib retracement level of the downward move from the $27.09 swing high to $16.00 low, above which the price could gain bullish momentum and rise towards the $24 resistance. Any more gains might send the price towards the $25 level.
Dips Limited in SOL?
If SOL fails to clear the $22.80 resistance, it could start a downside correction. An initial support on the downside is near the $20.50 level and the 100 simple moving average (4-hours).
The first major support is near the $19.80 level. The next major support is near the $18.80 level. If there is a downside break below the $18.80 support, the price might test the next key support at $18.00. The main support now sits near the $16.00 zone.
Technical Indicators
4-Hours MACD – The MACD for SOL/USD is gaining pace in the bullish zone.
4-Hours RSI (Relative Strength Index) – The RSI for SOL/USD is above the 50 level.
Major Support Levels – $20.50, $19.80 and $18.80.
Major Resistance Levels – $21.55, $22.80 and $25.


