
Reason to trust
How Our News is Made
Strict editorial policy that focuses on accuracy, relevance, and impartiality
Ad discliamer
Morbi pretium leo et nisl aliquam mollis. Quisque arcu lorem, ultricies quis pellentesque nec, ullamcorper eu odio.
Solana is rising above the $20 resistance against the US Dollar. SOL price might continue to rise steadily toward the $22 zone in the near term.
- SOL price is showing positive signs above the $19.50 level against the US Dollar.
- The price is now trading above $20 and the 100 simple moving average (4 hours).
- There is a major bullish trend line forming with support near $19.70 on the 4-hour chart of the SOL/USD pair (data source from Kraken).
- The pair could continue to move up unless there is a close below $18.00.
Solana Price Starts Recovery
In the past few days, Solana’s price started a fresh increase from the $15.65 support zone, similar to Bitcoin and Ethereum. The bulls gained strength for a clear move above the $18 resistance.
The price even climbed above the $20 level before the bears appeared. A high is formed near $20.95 and the price is now consolidating gains. It tested the 23.6% Fib retracement level of the upward move from the $15.64 swing low to the $20.95 high.
SOL is now trading above $20 and the 100 simple moving average (4 hours). There is also a major bullish trend line forming with support near $19.70 on the 4-hour chart of the SOL/USD pair.
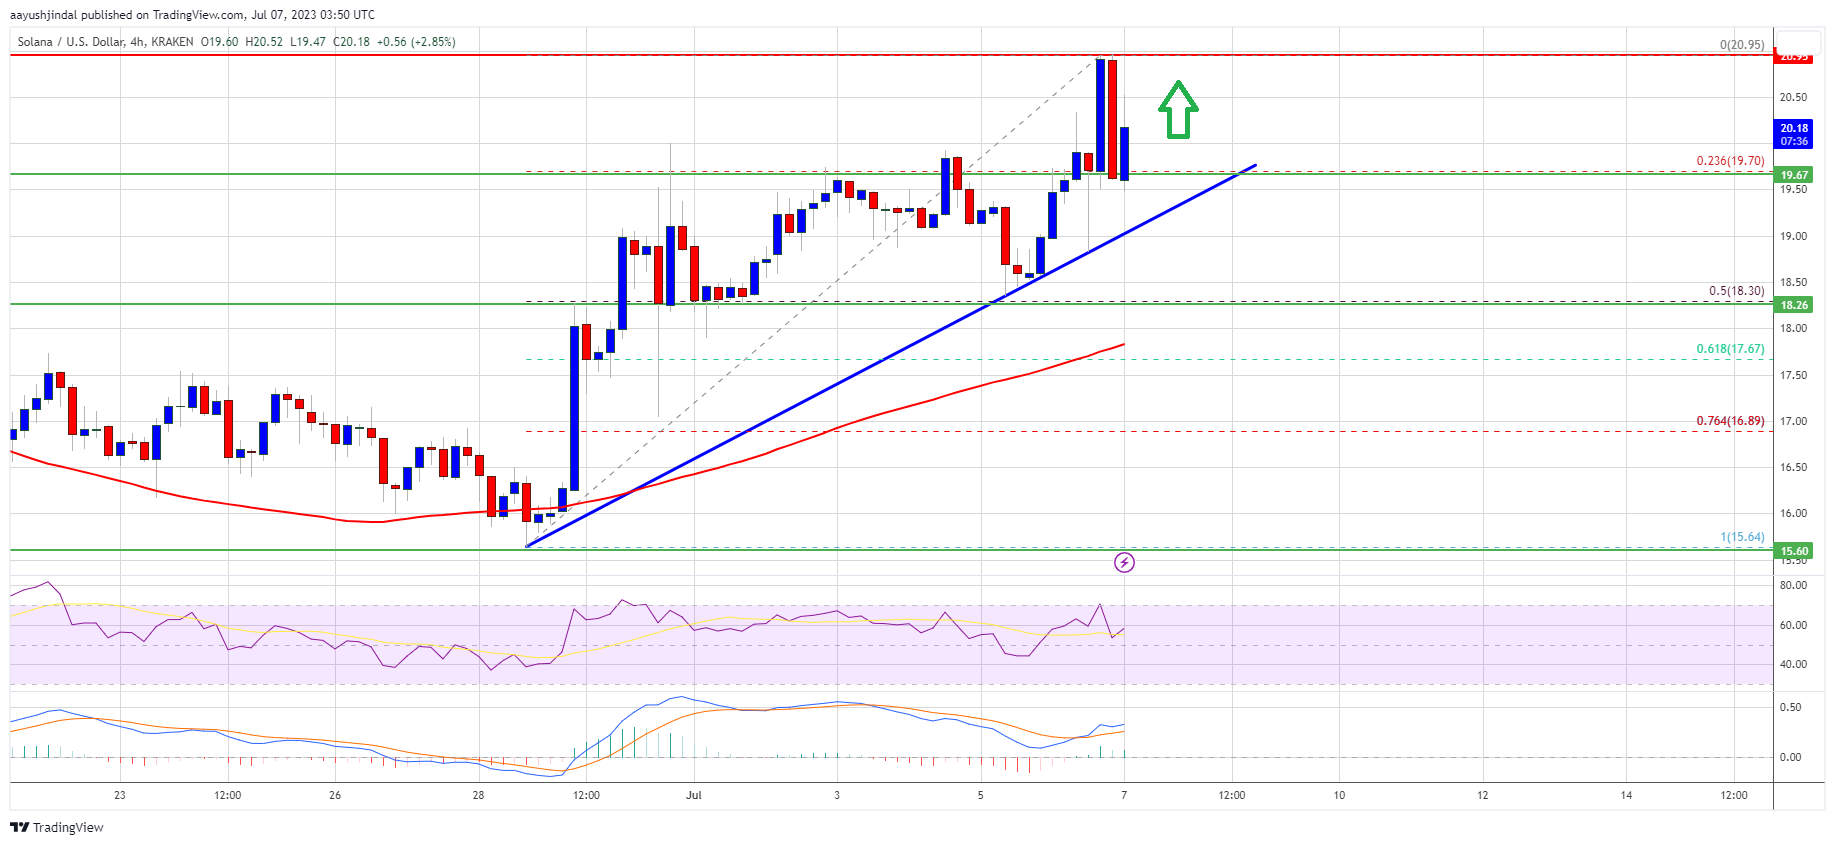
Source: SOLUSD on TradingView.com
On the upside, immediate resistance is near the $20.50 level. The first major resistance is near the $21 level. A clear move above the $21 resistance might send the price toward the $22 resistance. Any more gains might send the price toward the $22.40 level.
Downsides Supported in SOL?
If SOL fails to clear the $20.50 resistance, it could start a downside correction. Initial support on the downside is near the $19.70 level and the trend line.
The first major support is near the $18.40 level or the 50% Fib retracement level of the upward move from the $15.64 swing low to the $20.95 high. If there is a close below the $18.40 support, the price could decline sharply. In the stated case, the price may perhaps decline toward the $16.80 support. The next major support is near the $15.65 level.
Technical Indicators
4-Hours MACD – The MACD for SOL/USD is gaining pace in the bullish zone.
4-Hours RSI (Relative Strength Index) – The RSI for SOL/USD is above the 50 level.
Major Support Levels – $19.70, and $18.40.
Major Resistance Levels – $20.50, $21.00, and $22.00.


