
Reason to trust
How Our News is Made
Strict editorial policy that focuses on accuracy, relevance, and impartiality
Ad discliamer
Morbi pretium leo et nisl aliquam mollis. Quisque arcu lorem, ultricies quis pellentesque nec, ullamcorper eu odio.
Ripple is recovering above the $0.2450 resistance against the US Dollar. The current technical structure suggests XRP price is likely to surge above $0.2500 and $0.2550.
- Ripple is slowly gaining bullish momentum above the $0.2450 resistance against the US dollar.
- The price is trading near the $0.2500 resistance, but it is above the 100 hourly simple moving average.
- There is a key bullish trend line forming with support near $0.2470 on the hourly chart of the XRP/USD pair (data source from Kraken).
- The pair could accelerate higher if it clears the $0.2500 and $0.2550 resistance levels.
Ripple Price Likely To Accelerate Higher
In the past three sessions, there was a decent recovery in ripple above the $0.2400 level. XRP price broke the $0.2450 resistance level and the 100 hourly simple moving average to start the current recovery.
There was a break above the 50% Fib retracement level of key decline from the $0.2535 swing high to $0.2380 swing low. The price is now testing the $0.2480 and $0.2500 resistance levels.
The 76.4% Fib retracement level of key decline from the $0.2535 swing high to $0.2380 swing low is also near the $0.2500 level. More importantly, there is a key bullish trend line forming with support near $0.2470 on the hourly chart of the XRP/USD pair.
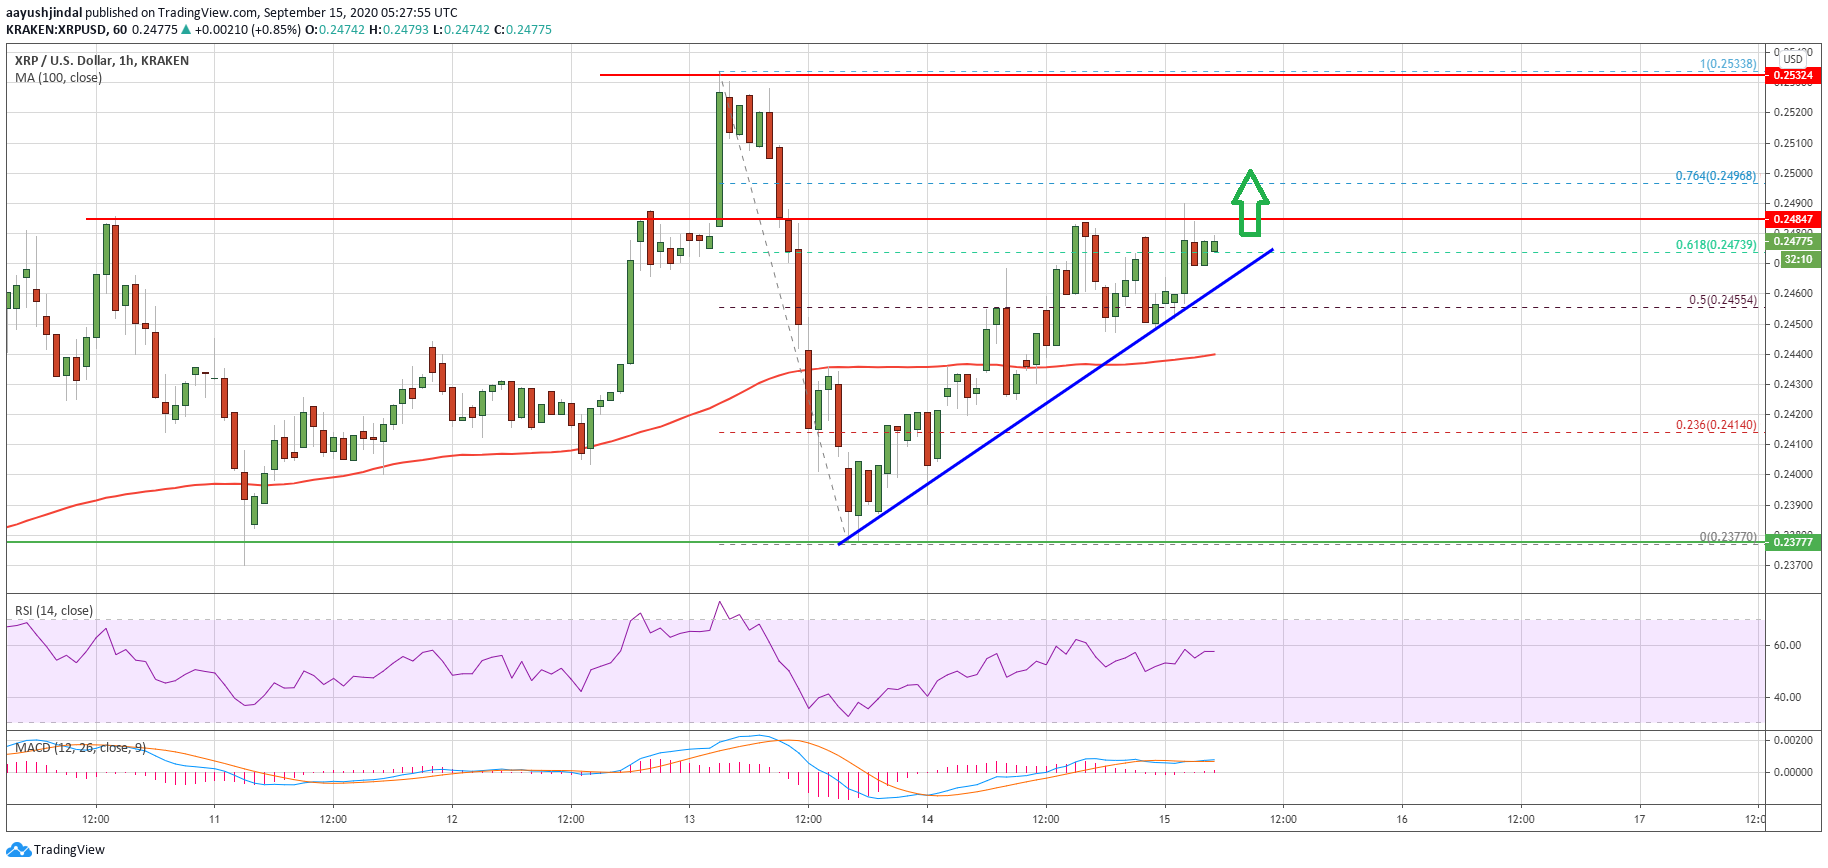
Ripple price trades above $0.2450. Source: TradingView.com
The current price action is positive, a close above the 100 hourly SMA, and the recent rise in bitcoin, bitcoin cash and ethereum are key reasons why ripple price might continue to rise above the $0.2480 and $0.2500 levels.
The next resistance is near the $0.2550 level. A successful close above the $0.2550 zone could open the doors for a strong rise towards the $0.2650 and $0.2700 resistance levels in the near term.
Another Failure in XRP?
If ripple fails to clear the $0.2480 and $0.2500 resistance levels, there could be a bearish reaction. An initial support on the downside is near the trend line at $0.2470.
The main support is forming near the $0.2440 level and the 100 hourly simple moving average. A downside break below the $0.2440 support and the 100 hourly simple moving average could lead the price towards the $0.2380 support zone in the near term.
Technical Indicators
Hourly MACD – The MACD for XRP/USD is slowly gaining momentum in the bullish zone.
Hourly RSI (Relative Strength Index) – The RSI for XRP/USD is currently well above the 50 level with positive signs.
Major Support Levels – $0.2470, $0.2440 and $0.2380.
Major Resistance Levels – $0.2480, $0.2500 and $0.2550.


