
Reason to trust
How Our News is Made
Strict editorial policy that focuses on accuracy, relevance, and impartiality
Ad discliamer
Morbi pretium leo et nisl aliquam mollis. Quisque arcu lorem, ultricies quis pellentesque nec, ullamcorper eu odio.
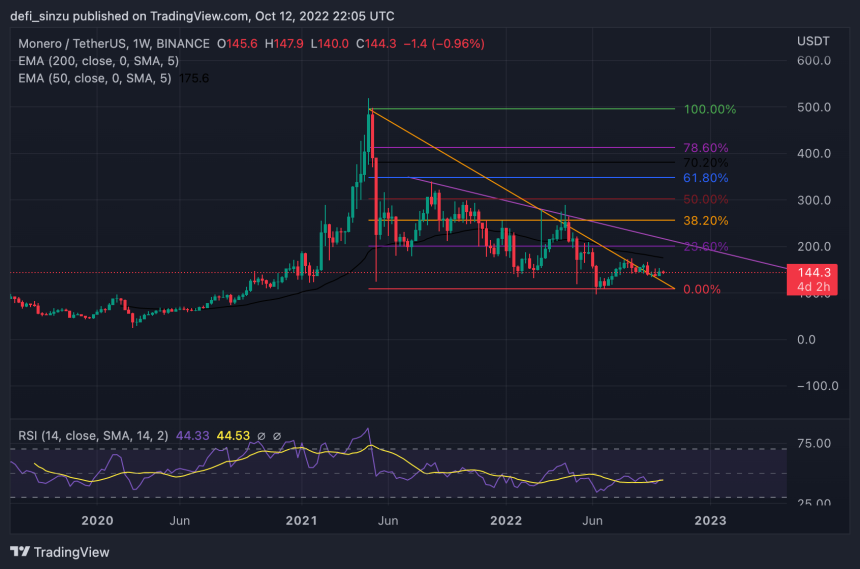
- XRM price breaks down into a ranging channel as price failed to break above resistance, holding price from trending higher.
- XRM trades below 50 and 200-day Exponential Moving Average as the price struggles to regain bullish signs as the price continues ranging in a descending triangle.
- The price of XRM needs to break out of the descending triangle with good volume to rally high to a region of $200.
Monero (XRM) prices continue to struggle as they range in a channel in an attempt to rekindle their bullish movement against tether (USDT). Monero (XRM) and other crypto assets experienced a relief bounce in recent weeks, which saw the crypto market cap look good for cryptocurrencies across the industry, with many producing double-digit gains. Monero (XRM) showed some relief bounces but was quickly rejected into a range price movement. (Data from Binance)

Monero (XRM) Price Analysis On The Weekly Chart
Despite having a tough time in recent months with the price falling to a low of $100 with over 70% drop from an all-time high of $517. This incredible price movement was cut short due to the market condition. The crypto market has remained in a bear market for over six months, leading to many crypto assets retesting their weekly low while others hang on to key support.
After the price of XRM rallied to a high of $260, the price declined as it dropped to a weekly low of $100, where the price held strong after forming support, and this region looked like a demand zone for prices.
The price of XRM bounced off from this region of $100 as the price rallied to a weekly high of $150 as the price faced resistance to breaking higher as the price continued to range in a channel. The resistance value corresponds to the Fibonacci ratios (Fibs) at 38.2%, acting as resistance for the price to go higher. For XRM to trend, a higher price must overcome the resistance at $150.
Weekly resistance for the price of XRM – $150.
Weekly support for the price of XRM – $100.
Price Analysis Of XRM On The Daily (1D) Chart
On a daily timeframe, the price of XRM remains below the 50 and 200-day Exponential Moving Averages (EMA), which is not conducive to an upward price trend in the short term. Prices of $150 and $162 correspond to the 50 and 200 EMAs, which act as resistance for XRM.
For the price of XRM to resume its bullish trend, it must break above $162 with good volume closing above it.
Daily resistance for the XRM price – $162.
Daily support for the XRM price – $100.

Featured Image From zipmex, Charts From Tradingview