Reason to trust
How Our News is Made
Strict editorial policy that focuses on accuracy, relevance, and impartiality
Ad discliamer
Morbi pretium leo et nisl aliquam mollis. Quisque arcu lorem, ultricies quis pellentesque nec, ullamcorper eu odio.
MATIC price started a major decline from the $1.00 resistance zone. Polygon bears are in control and might aim more losses towards $0.70 in the near term.
- MATIC price started a major decline from well above $0.95 against the US dollar.
- The price is trading below $0.85 and the 100 simple moving average (4-hours).
- There is a major bearish trend line forming with resistance at $0.821 on the 4-hours chart of the MATIC/USD pair (data source from Kraken).
- The pair could continue to decline towards the $0.70 support zone in the near term.
Polygon’s MATIC Price Dives
Earlier this month, polygon’s price made an attempt to gain pace above the $1.0 resistance zone. However, MATIC struggled to gain bullish momentum for a move above $1.0.
A high was formed near $0.972 before the price started a fresh decline. There was a steady decline, similar to bitcoin and ethereum. The bears were able to push the price below the $0.90 support zone and the 100 simple moving average (4-hours).
Finally, the price broke a major support at $0.840 and traded as low as $0.7748. It is now consolidating losses near the $0.800 level. On the upside, an immediate resistance is near the $0.8210 zone.
There is also a major bearish trend line forming with resistance at $0.821 on the 4-hours chart of the MATIC/USD pair. The trend line is near the 23.6% Fib retracement level of the recent decline from the $0.972 swing high to $0.7748 low.
The first major resistance is forming near the $0.875 zone. It is near the 50% Fib retracement level of the recent decline from the $0.972 swing high to $0.7748 low.
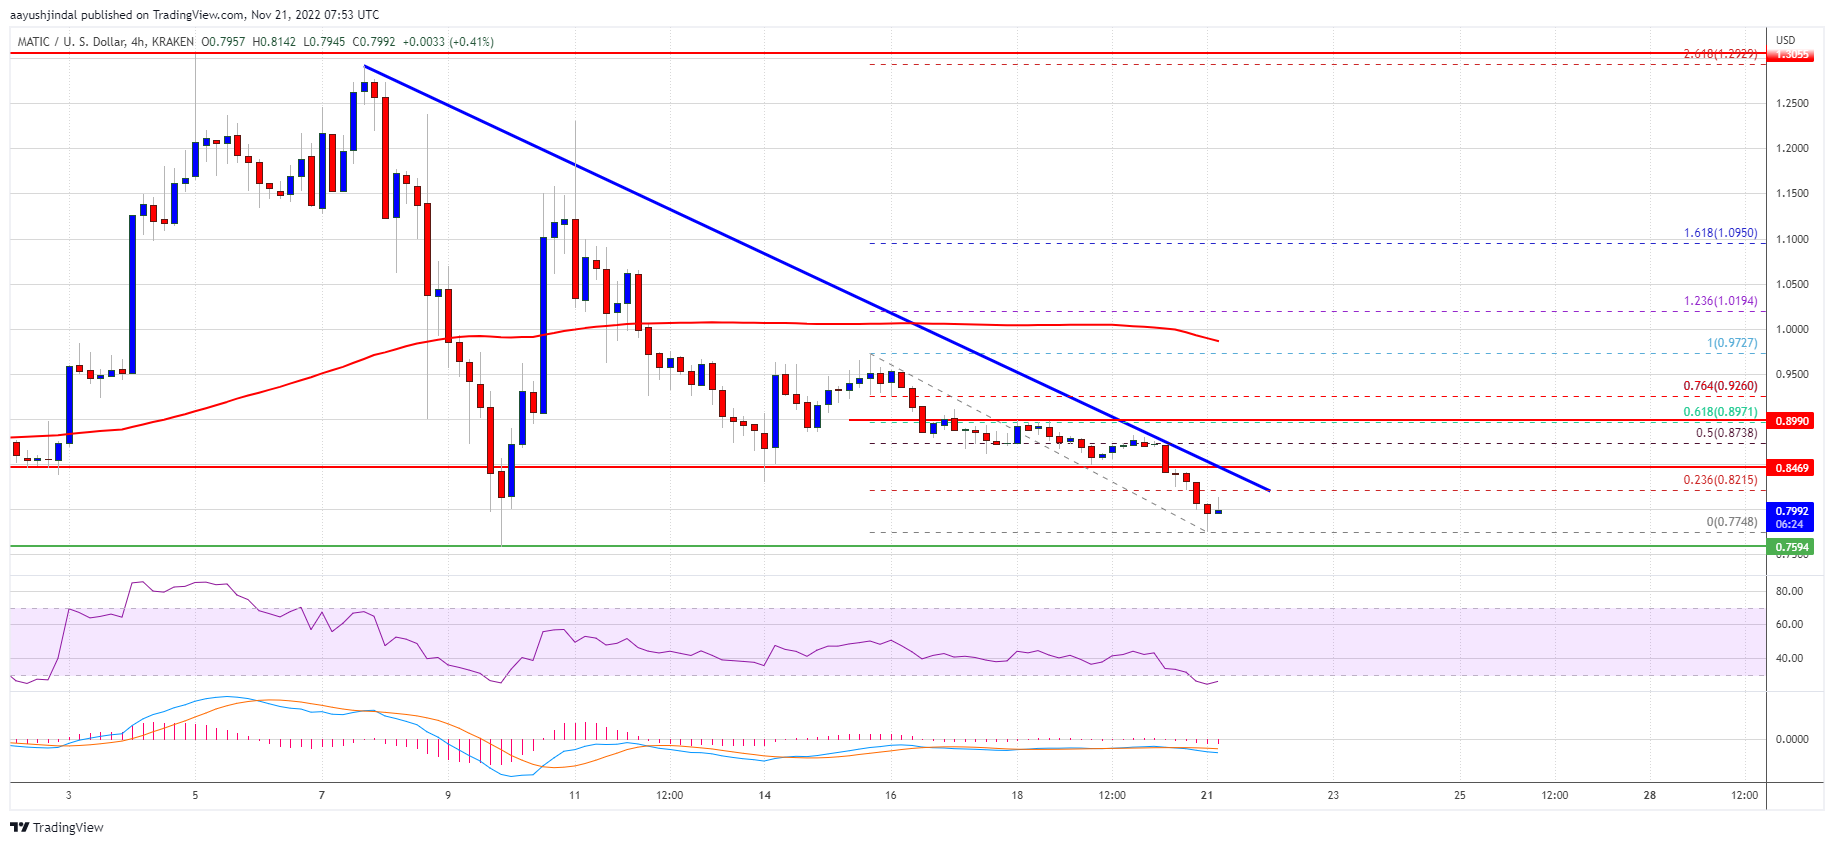
Source: MATICUSD on TradingView.com
The main resistance is now forming near the $1.00 level. If there is an upside break above the $0.90 and $1.00 resistance levels, the price could start another strong increase. In the stated case, the price could rise steadily towards the $1.20 level.
More Losses?
If MATIC price rise above the $0.82 and $0.87 resistance levels, it could continue to move down. An immediate support on the downside is near the $0.780 level.
The main support is near the $0.750 level. A downside break below the $0.750 level could open the doors for a fresh decline towards $0.70. The next major support is near the $0.665 level.
Technical Indicators
4-hours MACD – The MACD for MATIC/USD is slowly losing momentum in the bearish zone.
4-hours RSI (Relative Strength Index) – The RSI for MATIC/USD is now below the 50 level.
Major Support Levels – $0.78 and $0.70.
Major Resistance Levels – $0.821, $0.875 and $1.00.