
Reason to trust
How Our News is Made
Strict editorial policy that focuses on accuracy, relevance, and impartiality
Ad discliamer
Morbi pretium leo et nisl aliquam mollis. Quisque arcu lorem, ultricies quis pellentesque nec, ullamcorper eu odio.
MATIC price started a fresh increase from the $0.80 support zone. Polygon bulls are now aiming a another increase above the $1.05 resistance zone.
- MATIC price started a decent increase above the $0.85 resistance against the US dollar.
- The price is trading above $0.92 and the 100 simple moving average (4-hours).
- There is a key bullish trend line forming with support near $0.955 on the 4-hours chart of the MATIC/USD pair (data source from Kraken).
- The pair could continue to rise towards the $1.08 and $1.20 resistance levels.
Polygon’s MATIC Price Eyes More Upsides
This past month, polygon’s price declined below the $0.80 support zone. MATIC even broke the $0.75 support zone and the 100 simple moving average (4-hours).
However, the bulls were active near the $0.70 support zone. A base was formed above the $0.75 level and the price started a fresh increase. The price was able to clear the $0.80 and $0.85 resistance levels. The bulls took control above the $0.90 level and the 100 simple moving average (4-hours).
Finally, the price spiked above the $1.0 level, outperforming bitcoin and ethereum. A high is formed near $1.05 and the price is now consolidating gains. It is trading above $0.92 and the 100 simple moving average (4-hours).
MATIC price is also trading above the 23.6% Fib retracement level of the upward move from the $0.831 swing low to $1.054 high. On the upside, an immediate resistance is near the $1.02 level. The first major resistance is forming near the $1.05 zone.
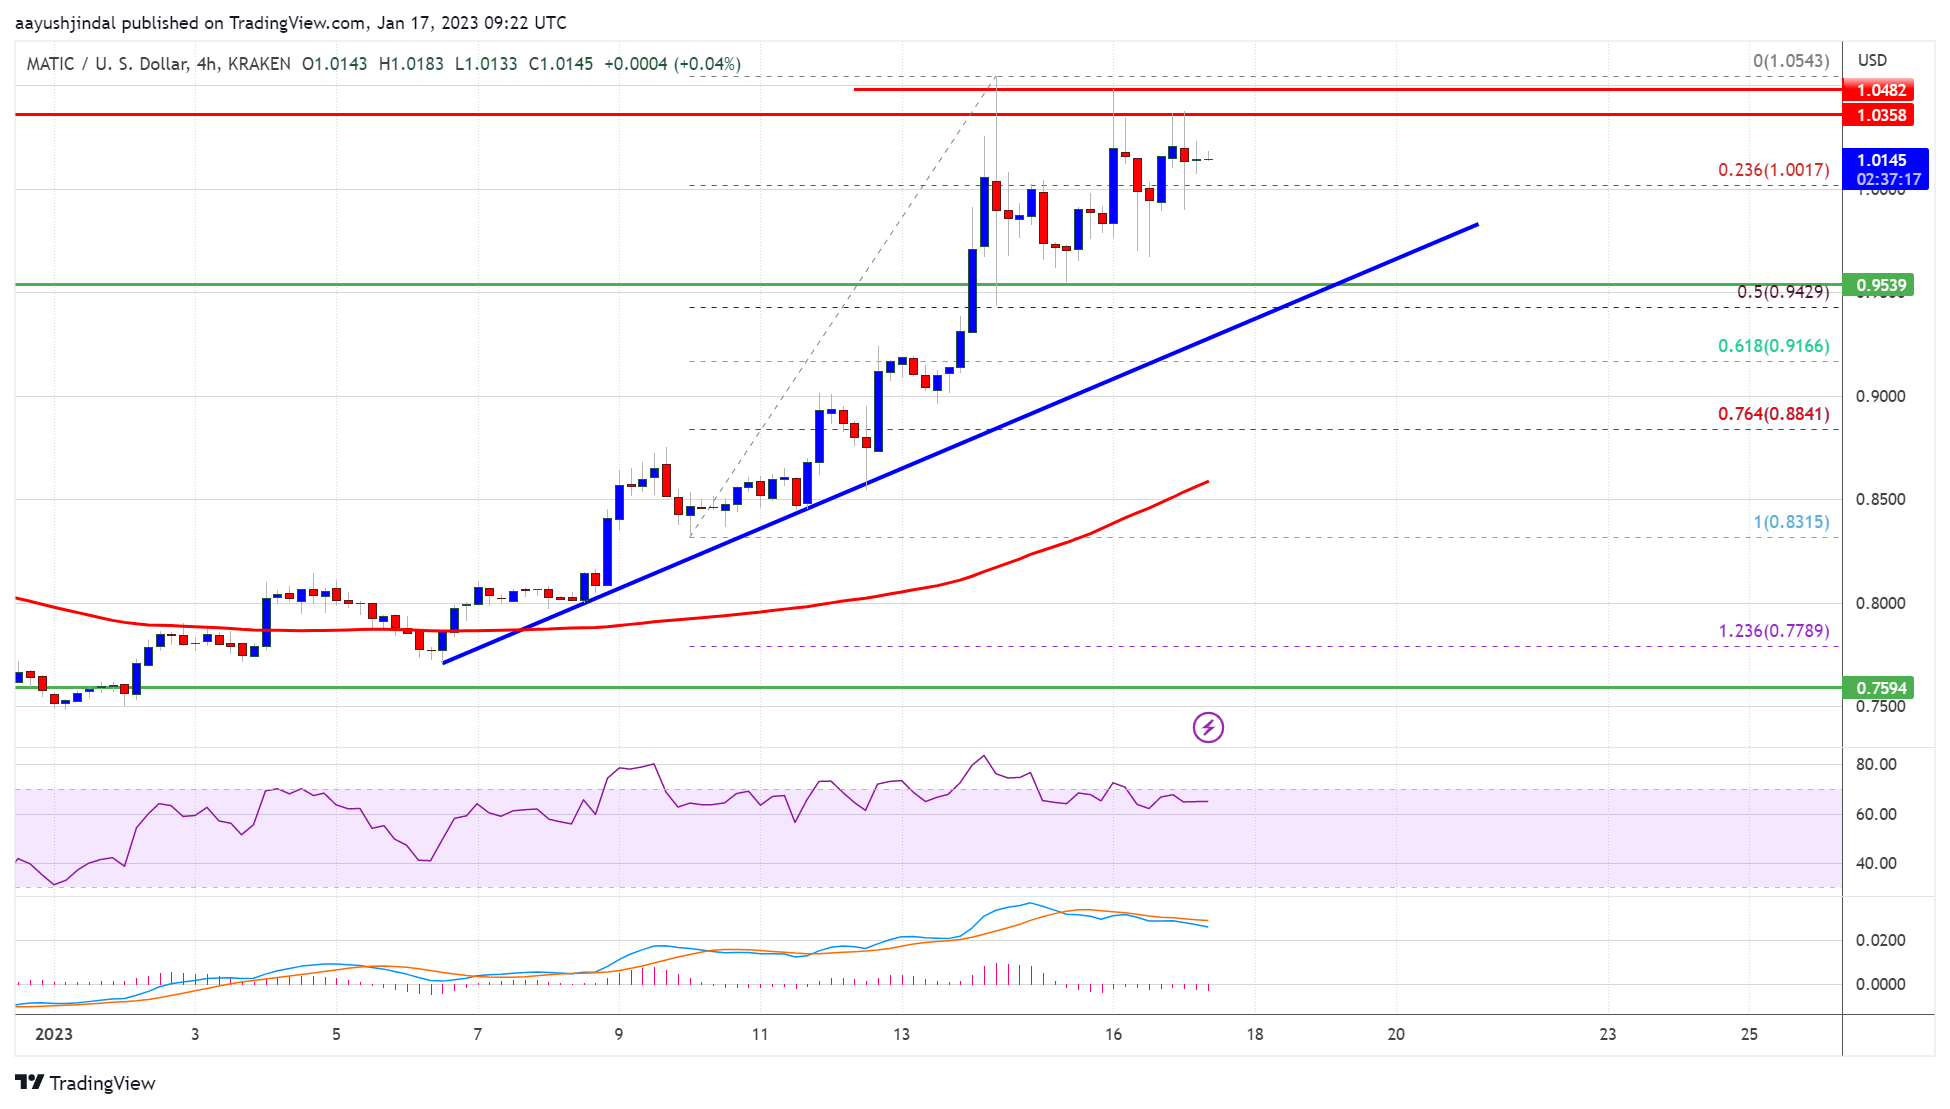
Source: MATICUSD on TradingView.com
If there is an upside break above the $1.02 and $1.05 resistance levels, the price could start another strong increase. In the stated case, the price could rise steadily towards the $1.20 level.
Dips Limited in MATIC?
If MATIC price fails to rise above the $1.02 and $1.05 resistance levels, it could start a downside correction. An immediate support on the downside is near the $1.0 level.
The main support is near the $0.950 level and a bullish trend line. A downside break below the $0.950 level could open the doors for a fresh decline towards $0.90. The next major support is near the $0.85 level.
Technical Indicators
4-hours MACD – The MACD for MATIC/USD is gaining momentum in the bullish zone.
4-hours RSI (Relative Strength Index) – The RSI for MATIC/USD is now above the 50 level.
Major Support Levels – $1.0 and $0.95.
Major Resistance Levels – $1.02, $1.05 and $1.20.


