Reason to trust
How Our News is Made
Strict editorial policy that focuses on accuracy, relevance, and impartiality
Ad discliamer
Morbi pretium leo et nisl aliquam mollis. Quisque arcu lorem, ultricies quis pellentesque nec, ullamcorper eu odio.
Chainlink (LINK) started a strong rally after a major correction towards the $9.80 level. The price is up over 20% and it is likely to continue higher above the $12.50 resistance.
- Chainlink token price is surging and it recently broke the $12.00 resistance against the US dollar.
- The price is still trading well above $11.80 and the 100 simple moving average (4-hours).
- There was a break above a crucial declining channel with resistance near $11.00 on the 4-hours chart of the LINK/USD pair (data source from Kraken).
- The pair is consolidating gains, but it is likely to continue higher above the $12.50 resistance level.
Chainlink (LINK) Price Turns Green
After a major downside correction (as discussed in the previous analysis), chainlink (LINK) found support near the $9.80 level. A low was formed near $9.79 before the price started a strong upward move.
Bitcoin and ether gained traction in the past few sessions, resulting in a strong rally in altcoins such as litecoin, ripple, LINK, and bitcoin cash. LINK gained over 20% and it broke many hurdles near $10.00 and $11.00.
The recent increase was initiated after there was a break above a crucial declining channel with resistance near $11.00 on the 4-hours chart of the LINK/USD pair. The pair broke the main $11.50 resistance and settled above the 100 simple moving average (4-hours).
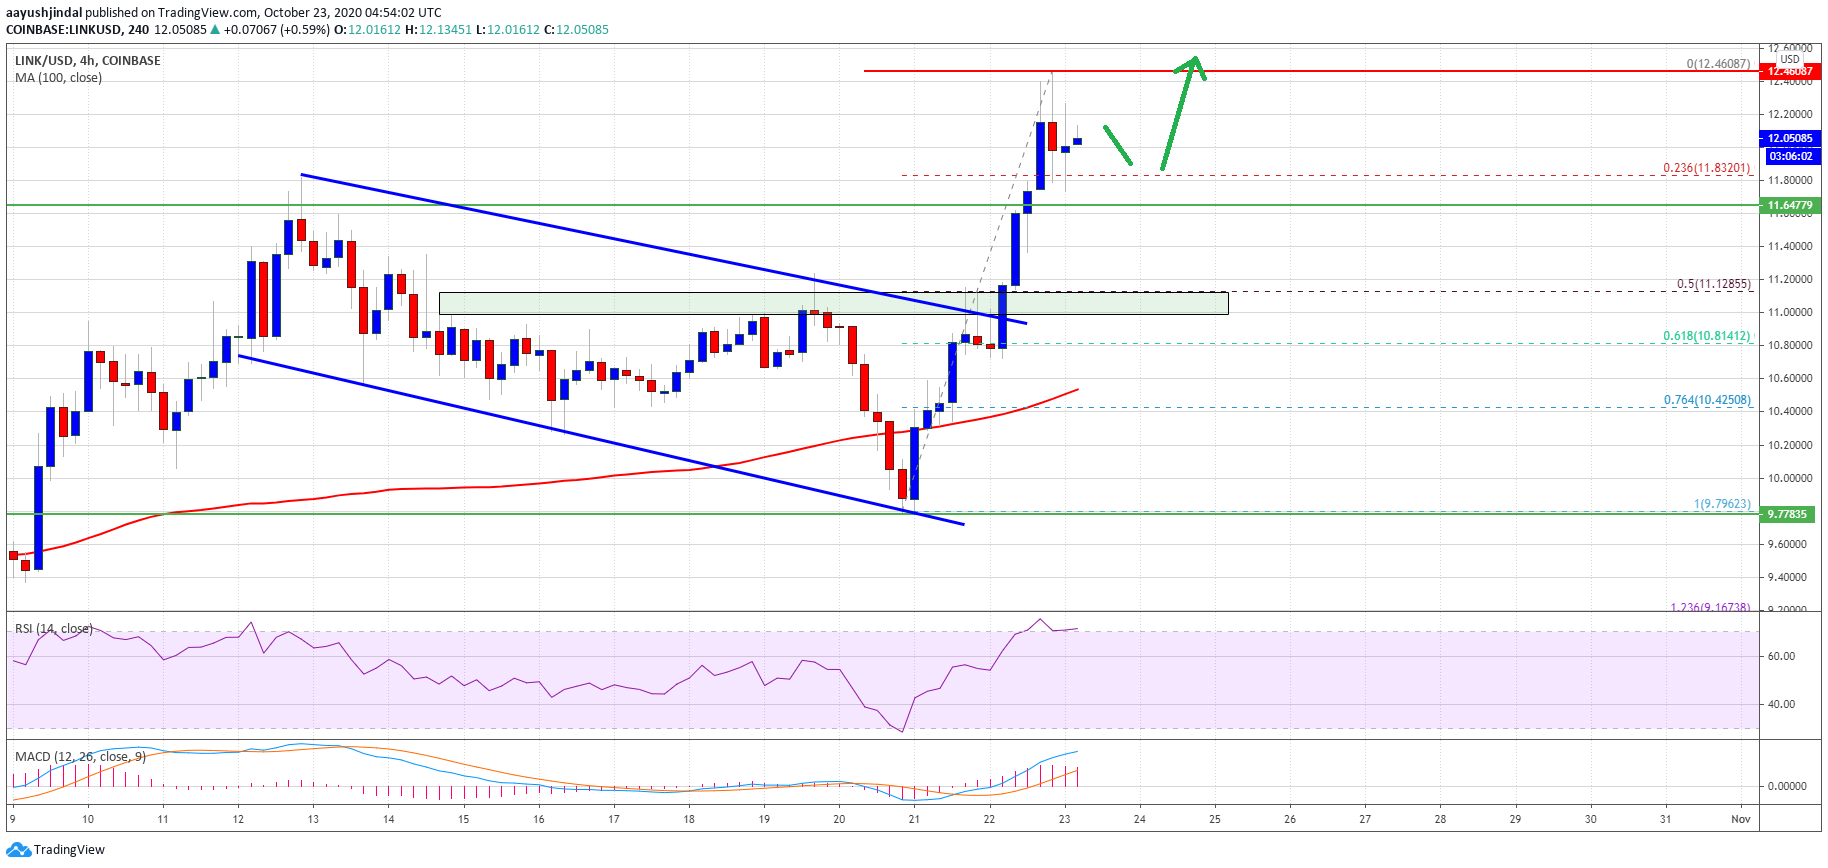
Source: LINKUSD on TradingView.com
It surged above the $12.00 resistance and traded to a new monthly high near the $12.46 level. The price is currently correcting lower and trading below $12.20. There was a test of the 23.6% Fib retracement level of the recent rally from the $9.79 low to $12.46 high.
The next major support is near the $11.85 and $11.65 levels, below which the bears might aim a test of the 50% Fib retracement level of the recent rally from the $9.79 low to $12.46 high.
On the upside, an initial resistance is near the $12.20 level. The first major hurdle is near the $12.50 level, above which the price could rally towards the $13.20 level.
Downside Correction?
If chainlink’s price starts a downside correction below the $11.80 support, there are chances of an extended decline in the coming sessions.
The next major support is near the $11.20 level, below which the bears are likely to aim a test of the 100 simple moving average (4-hours) at $10.60 in the coming days.
Technical Indicators
4-hours MACD – The MACD for LINK/USD is now gaining pace in the bullish zone.
4-hours RSI (Relative Strength Index) – The RSI for LINK/USD is now well above the 65 level.
Major Support Levels – $11.80, $11.65 and $11.20.
Major Resistance Levels – $12.20, $12.50 and $13.20.