
Reason to trust
How Our News is Made
Strict editorial policy that focuses on accuracy, relevance, and impartiality
Ad discliamer
Morbi pretium leo et nisl aliquam mollis. Quisque arcu lorem, ultricies quis pellentesque nec, ullamcorper eu odio.
Key Highlights
- ETH price climbed higher this past week above the $880 level before facing sellers against the US Dollar.
- There is a major bearish trend line forming with resistance at $860 on the 4-hours chart of ETH/USD (data feed via SimpleFX).
- The pair is currently correcting higher and it may correct further towards the $740 and $720 levels.
Ethereum price started a decent upside move against the US Dollar and Bitcoin. ETH/USD is currently correcting lower since it struggling to break the $890-900 levels.
Ethereum Price Trend
This past week, there was a good start to a new upside wave in ETH price above the $700 level against the US Dollar. The price made good ground and it was able to move above the $750 and $800 levels. However, the price struggled to move above the $880-900 resistance levels. It faced a strong sell zone near the $895-900 levels, which ignited a downside correction.
More importantly, there is a major bearish trend line forming with resistance at $860 on the 4-hours chart of ETH/USD. The pair recently failed to move above the trend line and declined below $850. It has breached the 23.6% Fib retracement level of the last wave from the $553 low to $897 high. The current trend is a bit bearish with signs of sellers around the $850-860 levels. On the downside, there is a major support near the $740 level. Moreover, the 50% Fib retracement level of the last wave from the $553 low to $897 high is near $725.
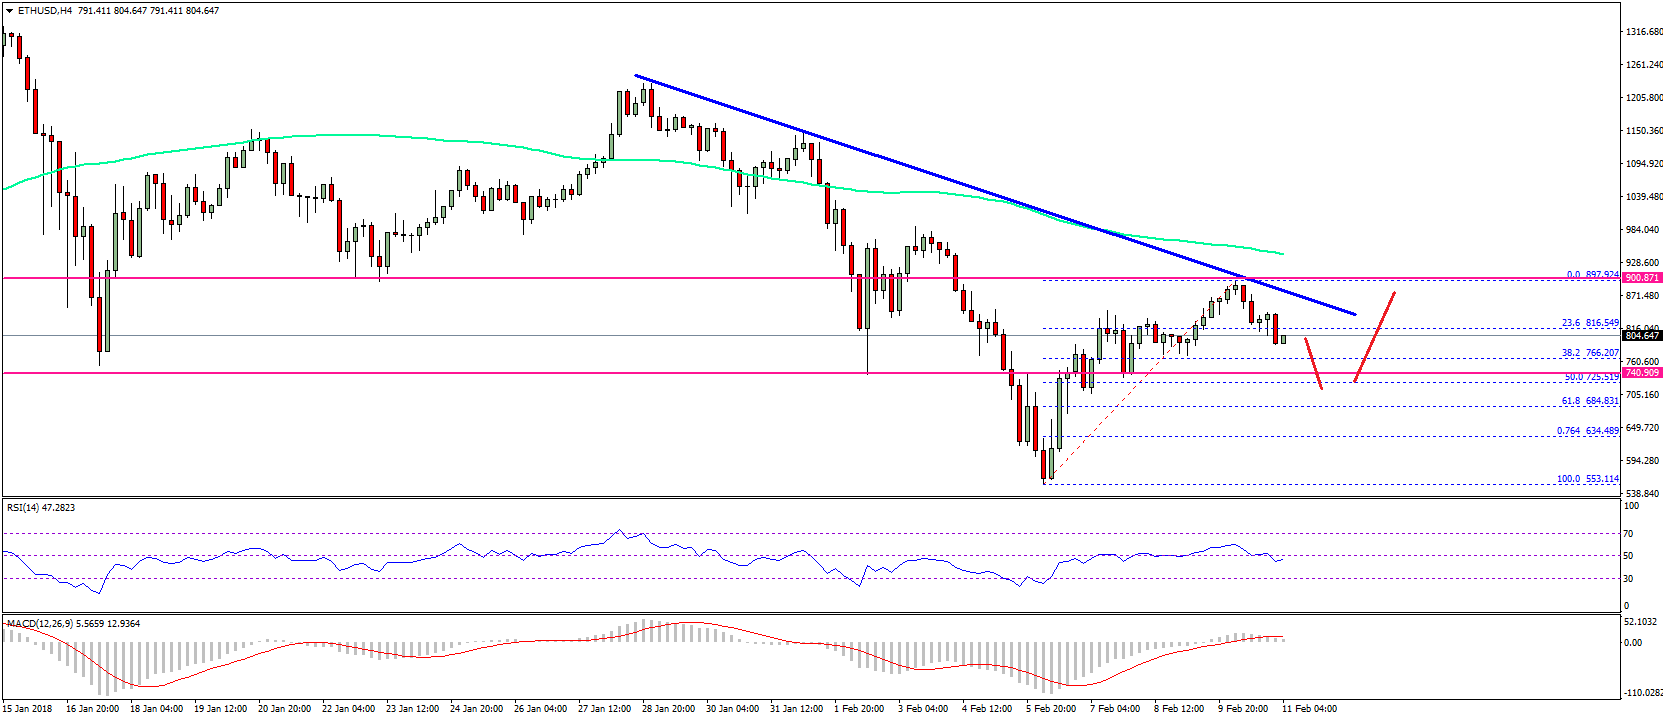
Therefore, the $725-740 zone is a decent support and the price may find bids near the stated levels. Below the mentioned $725, the price may once again come under bearish pressure. On the upside, the price has to close above $860 and $890 to gain upside momentum.
4-hours MACD – The MACD is currently moving lower in the bullish zone.
4-hours RSI – The RSI has moved below the 50 level.
Major Support Level – $725
Major Resistance Level – $860
Charts courtesy – SimpleFX