Reason to trust
How Our News is Made
Strict editorial policy that focuses on accuracy, relevance, and impartiality
Ad discliamer
Morbi pretium leo et nisl aliquam mollis. Quisque arcu lorem, ultricies quis pellentesque nec, ullamcorper eu odio.
Key Highlights
- The ETH price is struggling to clear a major resistance zone near $370 against the US Dollar.
- This week’s highlighted contracting triangle pattern with support at $335 on the hourly chart of ETH/USD (data feed via SimpleFX) is at risk of downside break.
- The pair is now trading below the 100 hourly simple moving average at $347, which is a bearish sign.
Ethereum price is struggling to hold gains against the US Dollar and Bitcoin, and it looks like ETH/USD may break $335 for more declines in the short term.
Ethereum Price Resistance
This week we followed a contracting range pattern with support as $330-335 for ETH price against the US Dollar. It looks like the price is struggling to hold the stated supports, as there was spike towards $318. However, the price recovered later, and moved above the $330 support. Another key point was a close below the 100 hourly simple moving average at $347. It is a short-term bearish sign, and suggests that the price may soon break $330.
On the upside, this week’s highlighted contracting triangle pattern with resistance at $365 on the hourly chart of ETH/USD is acting as a major hurdle. It prevented gains on many occasions, and pushed the price below $350. If sellers gain momentum once again, they can push the price below $330. The stated level also represents the 38.2% Fib retracement level of the last wave from the $256 low to $375 high.
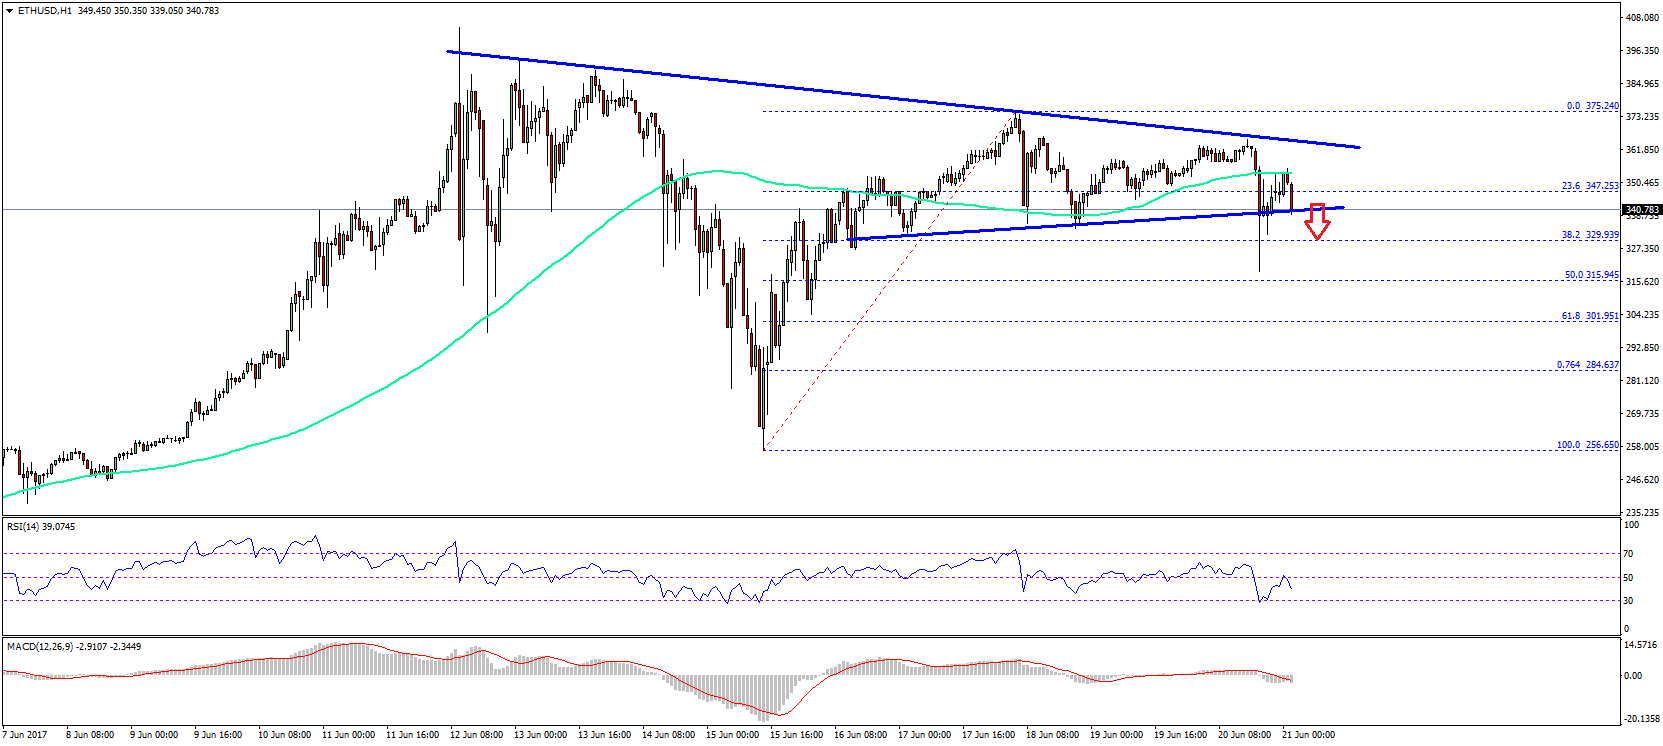
The only positive so far is the fact that there was no close below the contracting triangle pattern support at $335. Once there is an hourly close below $330, there can be an increase in the bearish pressure. On the upside, the triangle resistance is currently at $364, which is a major barrier for buyers.
Hourly MACD – The MACD has moved into the bearish zone.
Hourly RSI – The RSI is now below the 50 level, and heading lower.
Major Support Level – $330
Major Resistance Level – $364
Charts courtesy – SimpleFX