Reason to trust
How Our News is Made
Strict editorial policy that focuses on accuracy, relevance, and impartiality
Ad discliamer
Morbi pretium leo et nisl aliquam mollis. Quisque arcu lorem, ultricies quis pellentesque nec, ullamcorper eu odio.
Ethereum is struggling to clear the $360 and $365 resistance levels against the US Dollar. ETH price is showing bearish signs and it could dive below $350 and $345.
- Ethereum is still facing a heavy resistance near the $360 and $365 levels.
- The price is currently stuck near the $355 support and the 100 hourly simple moving average.
- There is a new connecting bullish trend line forming with support near $352 on the hourly chart of ETH/USD (data feed via Kraken).
- The pair is likely to continue lower if it breaks the $352 and $350 support levels.
Ethereum Price is Facing Many Hurdles
Ethereum remained stable above the $350 support level, but it is still facing a heavy resistance near the $360 and $365 levels. ETH started an upward move from the $350 low and climbed above the 100 hourly simple moving average.
There was a break above the 23.6% Fib retracement level of the downward move from the $369 high to $350 low. However, the $360 resistance and the broken bullish trend line seems to be acting as a strong resistance for the bulls.
The 50% Fib retracement level of the downward move from the $369 high to $350 low is also acting as a resistance. Ether price is currently declining and trading near the $355 support level.
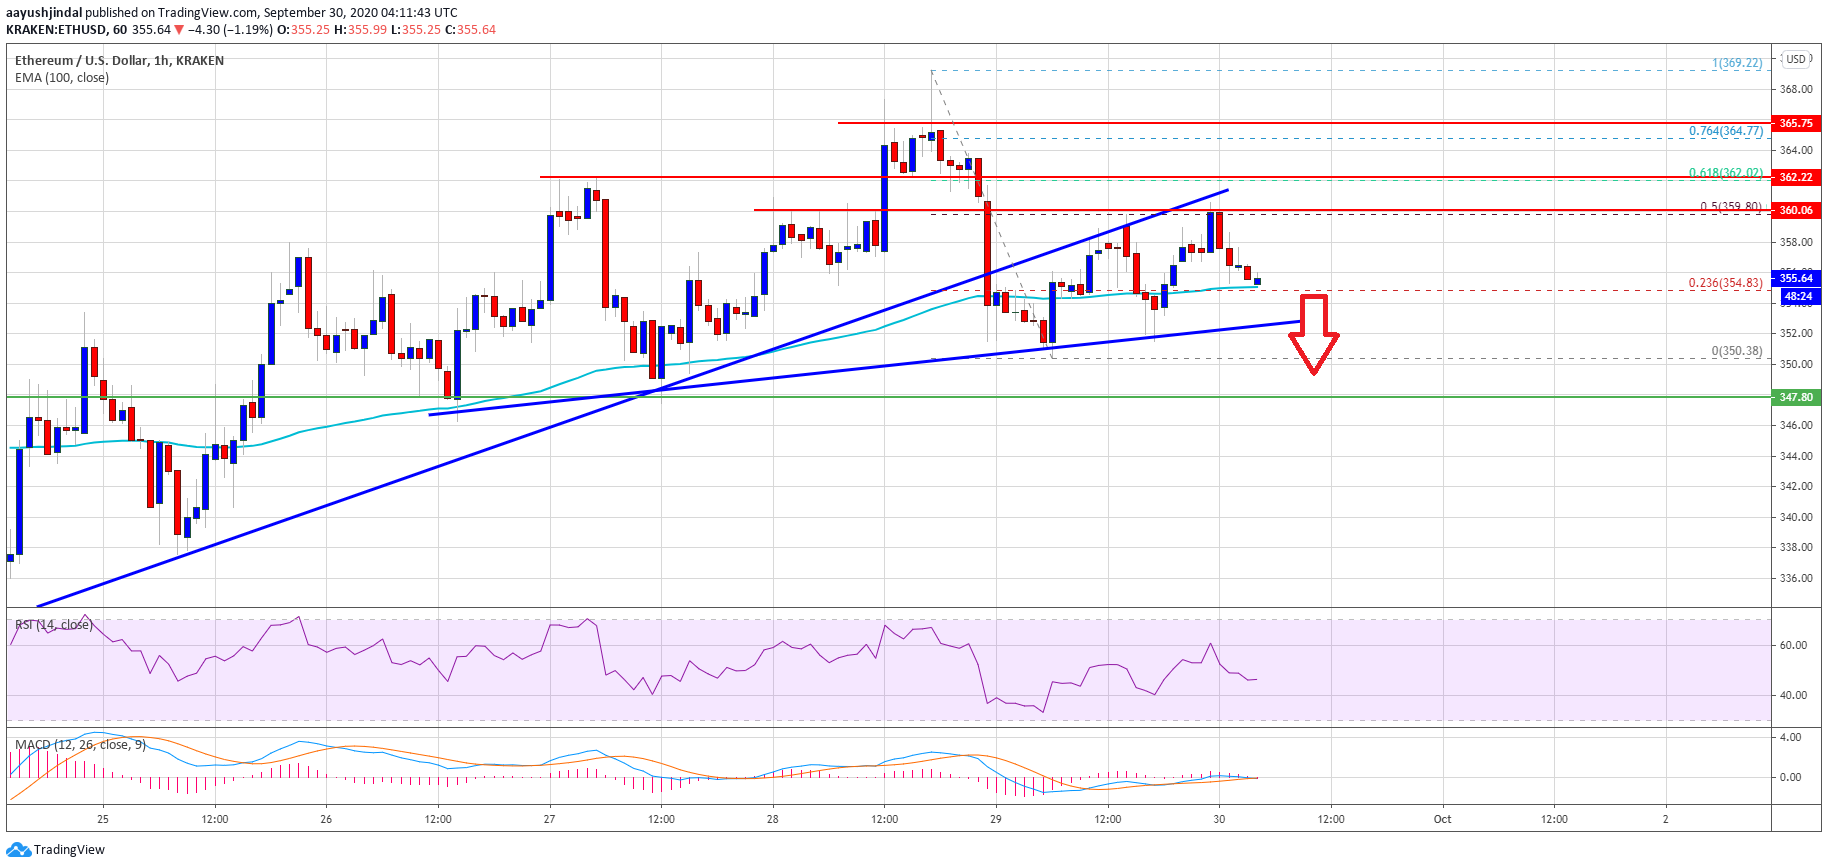
Ethereum price trades below $360. Source: TradingView.com
It seems like there is a new connecting bullish trend line forming with support near $352 on the hourly chart of ETH/USD. If ether continues to move down and breaks the trend line support at $352, there is a risk of a bearish break.
The next major support is near the $350 and $348 levels, below which the bears are likely to aim a larger decline towards the $335 support level in the near term.
Chances of Upside Break in ETH?
If Ethereum manages to stay above the $352 and $350 support levels, there are chances of an upside break. An initial resistance is near the $360 level.
The first key resistance could be near the $362 level, above which the bulls might aim a clear break above the $365 resistance level. The next major resistance is near the $375 zone.
Technical Indicators
Hourly MACD – The MACD for ETH/USD is slowly moving back into the bearish zone.
Hourly RSI – The RSI for ETH/USD is currently declining and it is well below the 50 level.
Major Support Level – $350
Major Resistance Level – $360