
Reason to trust
How Our News is Made
Strict editorial policy that focuses on accuracy, relevance, and impartiality
Ad discliamer
Morbi pretium leo et nisl aliquam mollis. Quisque arcu lorem, ultricies quis pellentesque nec, ullamcorper eu odio.
Ethereum started a downside correction from the $620 zone against the US Dollar. ETH price is now trading near a major support at $580 and the 100 hourly SMA
- Ethereum started a downside correction after it failed to clear the $620 and $625 resistance levels.
- The price traded below the $600 support, but it is still above the 100 hourly simple moving average.
- There is a key declining channel forming with resistance near $600 on the hourly chart of ETH/USD (data feed via Kraken).
- The pair could either climb above $600 or extend its decline towards the $550 support level.
Ethereum Price Corrects Lower
There were two attempts by Ethereum to surpass the $620 resistance level, but it failed. As a result, there was a bearish reaction and the price broke the $612 and $600 support levels.
The decline gained pace below the $600 support level and the price even broke the $585 level. Ether found support near the $580 level (the last key breakout zone) and it is still well above the 100 hourly simple moving average.
The price is currently consolidating losses above the $580 support. It is testing the 23.6% Fib retracement level of the recent decline from the $612 swing high to $580 swing low.
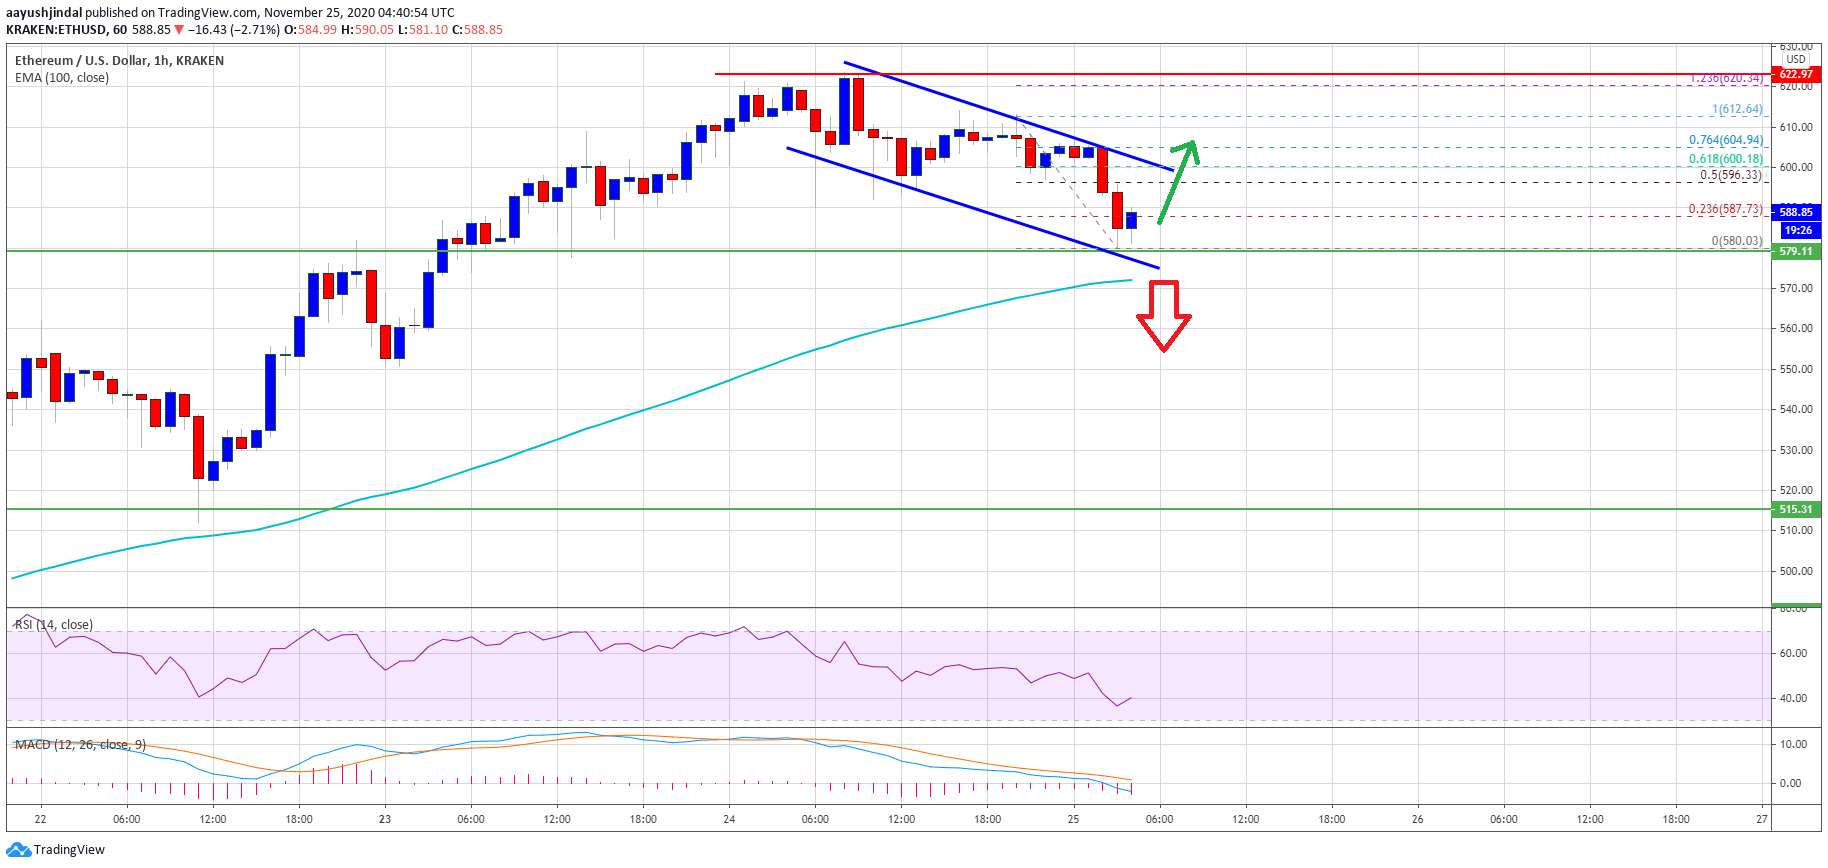
Source: ETHUSD on TradingView.com
On the upside, there is a major resistance forming near the $600 level. There is also a key declining channel forming with resistance near $600 on the hourly chart of ETH/USD. The channel resistance coincides with the 50% Fib retracement level of the recent decline from the $612 swing high to $580 swing low.
A successful break above the channel resistance could start a fresh increase above $605. The next major resistance is near $612, above which ether is likely to revisit the $620 resistance zone.
More Losses in ETH?
If ethereum fails to break the $600 resistance level, there could be more losses. The first major support is near the $580 level, below which the price could test the 100 hourly simple moving average at $570.
A clear break below the 100 hourly simple moving average may perhaps spark a larger downside correction below $565. The next major support could possibly be near the $550 level.
Technical Indicators
Hourly MACD – The MACD for ETH/USD is slowly gaining momentum in the bearish zone.
Hourly RSI – The RSI for ETH/USD is now well below the 50 level.
Major Support Level – $580
Major Resistance Level – $600