
Reason to trust
How Our News is Made
Strict editorial policy that focuses on accuracy, relevance, and impartiality
Ad discliamer
Morbi pretium leo et nisl aliquam mollis. Quisque arcu lorem, ultricies quis pellentesque nec, ullamcorper eu odio.
Ethereum gained bullish momentum for a move above $1,625 against the US Dollar. ETH is now showing positive signs and might soon test the $1,700 zone.
- Ethereum is up close to 5% and there was a clear move above the $1,625 resistance.
- The price is now trading above $1,600 and the 100 hourly simple moving average.
- There is a major bullish trend line forming with support near $1,580 on the hourly chart of ETH/USD (data feed via Kraken).
- The pair could continue to rise if it stays above $1,600 or $1,580.
Ethereum Price Beats Bitcoin
Ethereum started a steady increase from the $1,535 support zone. ETH was able to clear the key $1,600 resistance and the 100 hourly simple moving average to move into a positive zone, unlike bitcoin.
The bulls were able to push the price above the $1,625 resistance. It gained nearly 5% and there was a test of the $1,675 zone. A high was formed at $1,675 and there was a minor downside correction. The price dipped below the $1,650 level.
Ether price declined below the 23.6% Fib retracement level of the recent increase from the $1,535 swing low to $1,675 high. It is now trading above $1,600 and the 100 hourly simple moving average.
There is also a major bullish trend line forming with support near $1,580 on the hourly chart of ETH/USD. An immediate resistance on the upside is near the $1,650 level. The next major resistance is now forming near the $1,675 level.
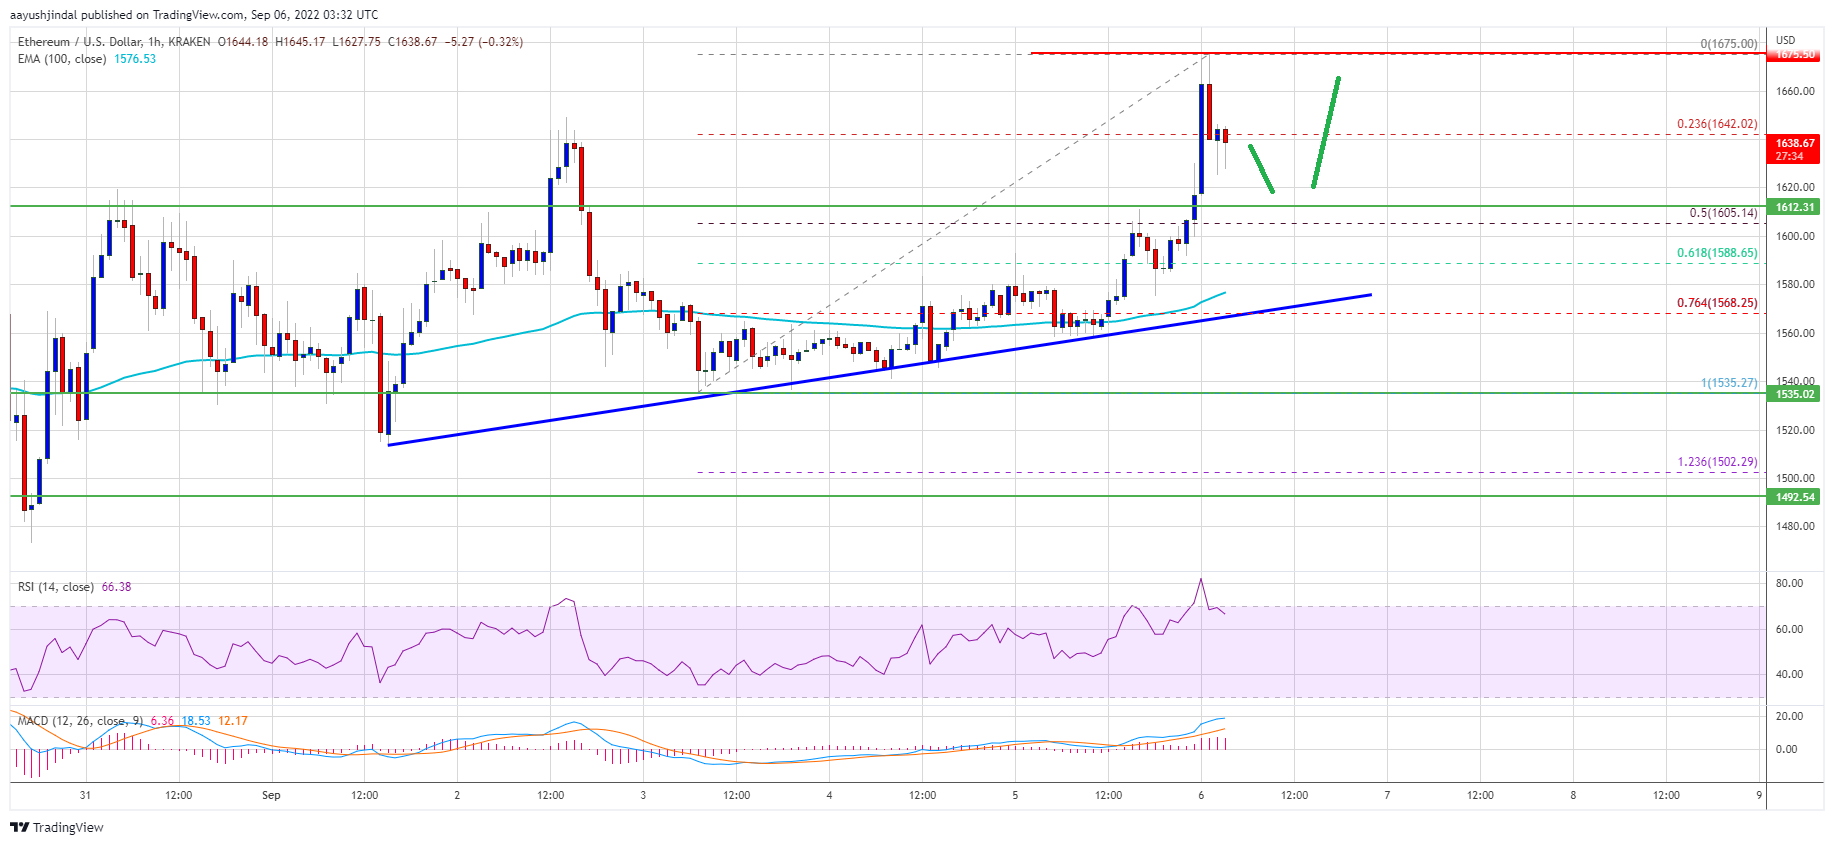
Source: ETHUSD on TradingView.com
A clear move above the $1,675 level might even push the price above the $1,700 resistance. The next major resistance sits near the $1,750 level. Any more gains may perhaps open the doors for a move towards the $1,800 resistance in the near term.
Dips Limited in ETH?
If ethereum fails to rise above the $1,650 resistance, it could start a downside correction. An initial support on the downside is near the $1,620 zone.
The next major support is near $1,600. It is near the 50% Fib retracement level of the recent increase from the $1,535 swing low to $1,675 high, below which ether price might test the trend line. Any more losses may perhaps send the price towards the $1,535 zone.
Technical Indicators
Hourly MACD – The MACD for ETH/USD is now gaining momentum in the bullish zone.
Hourly RSI – The RSI for ETH/USD is now above the 50 level.
Major Support Level – $1,600
Major Resistance Level – $1,675