Reason to trust
How Our News is Made
Strict editorial policy that focuses on accuracy, relevance, and impartiality
Ad discliamer
Morbi pretium leo et nisl aliquam mollis. Quisque arcu lorem, ultricies quis pellentesque nec, ullamcorper eu odio.
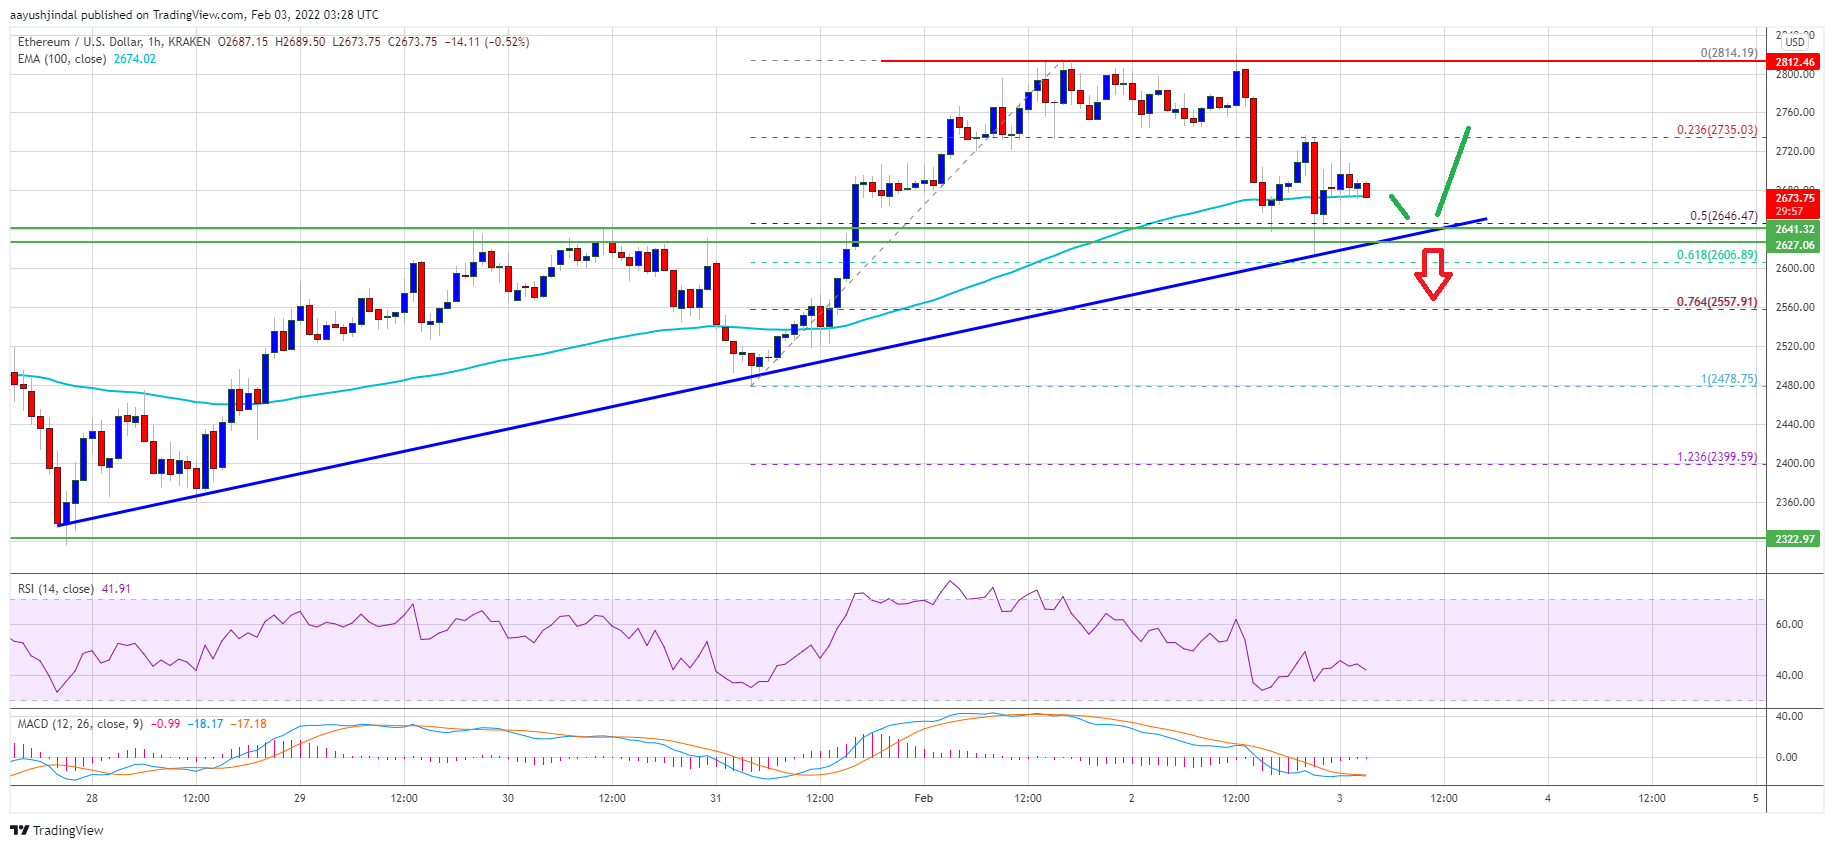
Ethereum failed to clear $2,800 and corrected gains against the US Dollar. ETH price must stay above the $2,600 support to avoid more downsides.
- Ethereum started a downside correction after it failed to surpass the $2,800 resistance.
- The price is now trading near $2,650 and the 100 hourly simple moving average.
- There is a crucial bullish trend line forming with support near $2,645 on the hourly chart of ETH/USD (data feed via Kraken).
- The pair could start a major decline if there is a move below $2,645 and $2,600.
Ethereum Price Dips
Ethereum made another attempt to clear the $2,800 resistance zone. ETH formed a high near $2,814 and started a fresh decline. There was a clear move below the $2,750 support level.
The price even spiked below the 50% Fib retracement level of the upward move from the $2,478 swing low to $2,815 high. It is now trading near $2,650 and the 100 hourly simple moving average. Besides, there was a test of the key $2,600 support level.
Ether price stayed above the 61.8% Fib retracement level of the upward move from the $2,478 swing low to $2,815 high. There is also a crucial bullish trend line forming with support near $2,645 on the hourly chart of ETH/USD.
An immediate resistance on the upside is near the $2,700 level. The first major resistance is near the $2,750 level. The main resistance for a larger increase is near the $2,800 level. A convincing move above the $2,800 resistance could stage a strong upward move.
Source: ETHUSD on TradingView.com
The next key resistance is near the $2,920 level, above which ether price might rise towards the $3,000 resistance zone in the near term.
Downside Break in ETH?
If ethereum fails to start a fresh increase above the $2,750 resistance, it could extend decline. An initial support on the downside is near the $2,645 level and the trend line.
A downside break below the trend line support may even push the price below the $2,600 support zone. The next major support is near the $2,500 level, where the bulls might take stand. If they fail, the price could slide to $2,400.
Technical Indicators
Hourly MACD – The MACD for ETH/USD is losing pace in the bearish zone.
Hourly RSI – The RSI for ETH/USD is now below the 50 level.
Major Support Level – $2,600
Major Resistance Level – $2,750