
Reason to trust
How Our News is Made
Strict editorial policy that focuses on accuracy, relevance, and impartiality
Ad discliamer
Morbi pretium leo et nisl aliquam mollis. Quisque arcu lorem, ultricies quis pellentesque nec, ullamcorper eu odio.
Ethereum extended decline below the $2,600 support zone against the US Dollar. ETH price could even retest $2,445, where the bulls might appear.
- Ethereum remained in a bearish zone below the $2,650 support.
- The price is now trading below $2,600 and the 100 hourly simple moving average.
- There is a key bearish trend line forming with resistance near $2,600 on the hourly chart of ETH/USD (data feed via Kraken).
- The pair could extend decline if it fails to stay above $2,500 and $2,445.
Ethereum Price Turns Red
Ethereum started a fresh decline from well above $2,700. ETH traded below the $2,650 and $2,600 support levels to move into the red zone.
There was also a close below the $2,600 level and the 100 hourly simple moving average. Ether price traded as low as $2,525 and is currently consolidating losses. An immediate resistance on the upside is near the $2,585 level. It is near the 23.6% Fib retracement level of the recent decline from the $2,775 swing high to $2,525 low.
The first major resistance is seen near the $2,620 level and the 100 hourly simple moving average. There is also a key bearish trend line forming with resistance near $2,600 on the hourly chart of ETH/USD.
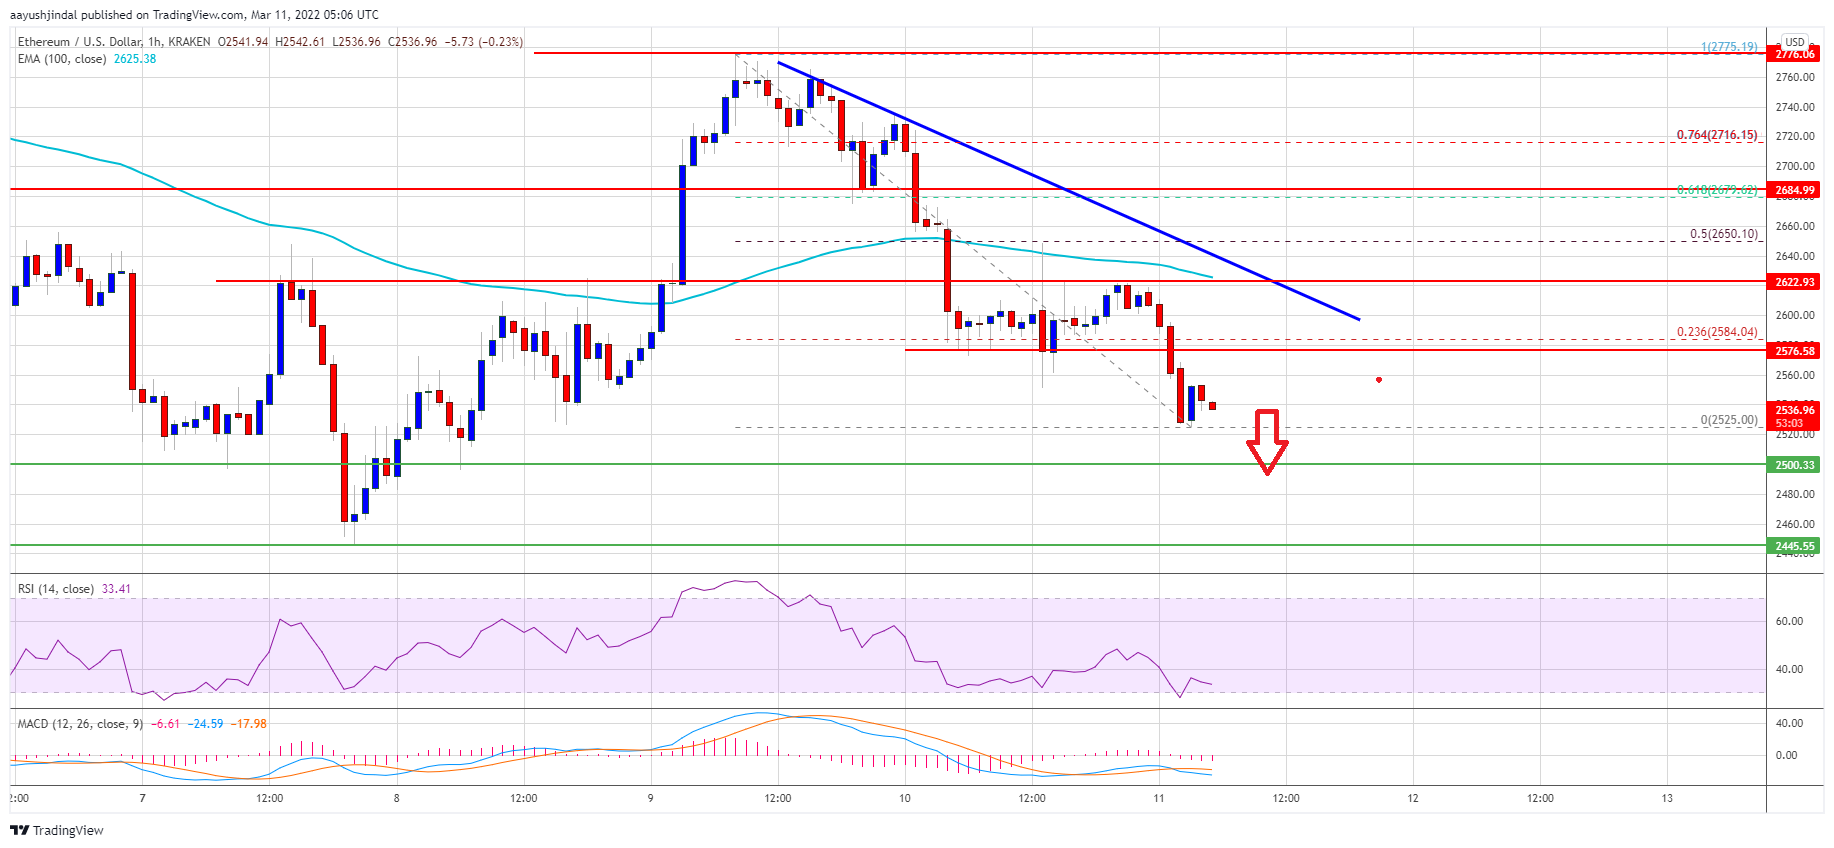
Source: ETHUSD on TradingView.com
The next major resistance is near the $2,650 level. It is near the 50% Fib retracement level of the recent decline from the $2,775 swing high to $2,525 low. A close above the $2,650 resistance could start a steady increase. In the stated case, the price might rise towards the $2,750 level, where the bears could take a stand in the near term.
More Losses in ETH?
If ethereum fails to start a fresh increase above the $2,620 level, it could continue to move down. An initial support on the downside is near the $2,525 level.
The next major support is near the $2,500 level. A close below the $2,525 and $2,500 support levels might push the price further lower. In the stated case, the price could revisit $2,445. Any more gains may perhaps open the doors for a larger decline towards the $2,320 level or even $2,250.
Technical Indicators
Hourly MACD – The MACD for ETH/USD is now gaining pace in the bearish zone.
Hourly RSI – The RSI for ETH/USD is now below the 50 level.
Major Support Level – $2,500
Major Resistance Level – $2,650