
Reason to trust
How Our News is Made
Strict editorial policy that focuses on accuracy, relevance, and impartiality
Ad discliamer
Morbi pretium leo et nisl aliquam mollis. Quisque arcu lorem, ultricies quis pellentesque nec, ullamcorper eu odio.
Ethereum gained pace above the $2,700 resistance against the US Dollar. ETH price could extend gains if there is a clear move above the $2,800 resistance.
- Ethereum gained pace above the $2,650 and $2,750 resistance levels.
- The price is now trading above $2,700 and the 100 hourly simple moving average.
- There is a key bullish trend line forming with support near $2,640 on the hourly chart of ETH/USD (data feed via Kraken).
- The pair could continue to rise if it clears the $2,800 resistance zone.
Ethereum Price Remains Supported
Ethereum remained formed a base above the $2,650 level and extended increase. ETH was able to clear the $2,750 resistance zone and settled well above the 100 hourly simple moving average.
The price even spiked above the $2,800 level and formed a high near the $2,814 level. It is now consolidating gains below the $2,800 level. It tested the $2,750 level and the 23.6% Fib retracement level of the recent increase from the $2,479 swing low to $2,814 high.
There is also a key bullish trend line forming with support near $2,640 on the hourly chart of ETH/USD. Overall, ether price is trading in a positive zone above $2,700 and the 100 hourly simple moving average.
An immediate resistance on the upside is near the $2,785 level. The first major resistance is near the $2,800 level. A proper close above the $2,800 resistance might push the price further higher. In the stated case, the pair could climb above the $2,850 zone.
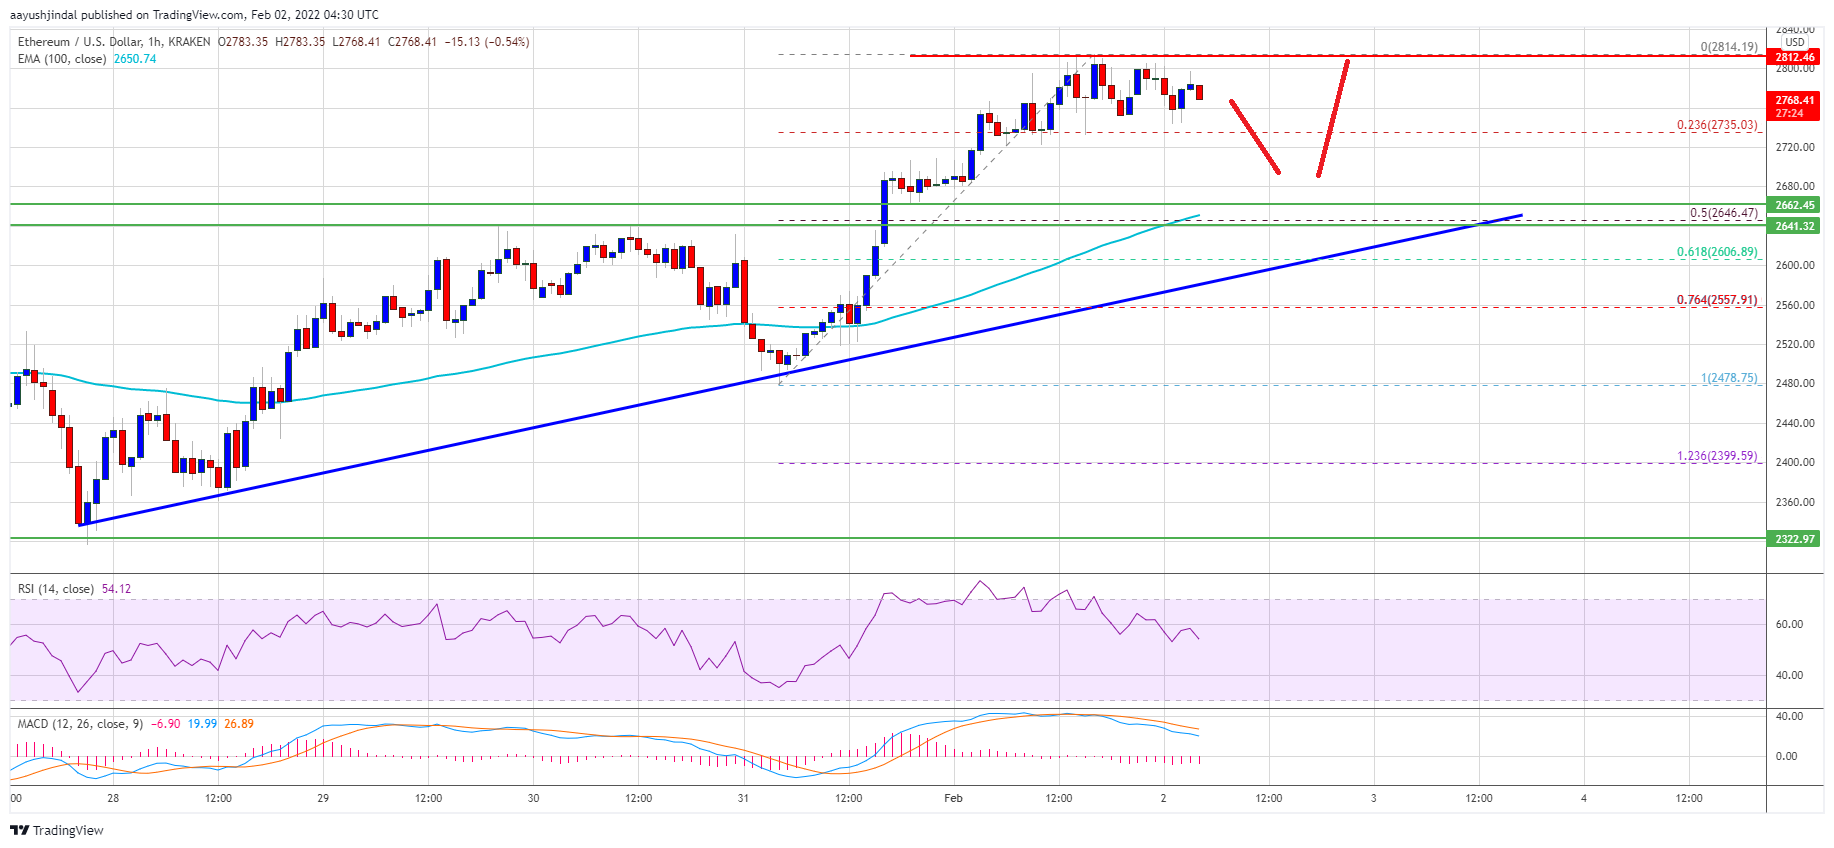
Source: ETHUSD on TradingView.com
The next key barrier for the bulls may perhaps be $2,920. Any more gains might send the price towards the $3,000 resistance zone in the coming sessions.
Dips Limited in ETH?
If ethereum fails to continue higher above the $2,800 resistance, it could start a downside correction. An initial support on the downside is near the $2,735 level.
The first key support is now forming near the $2,645 level. It is near the 50% Fib retracement level of the recent increase from the $2,479 swing low to $2,814 high. If there is a downside break below the $2,645 level, the price move down towards the $2,550 level.
Technical Indicators
Hourly MACD – The MACD for ETH/USD is losing pace in the bullish zone.
Hourly RSI – The RSI for ETH/USD is still above the 50 level.
Major Support Level – $2,645
Major Resistance Level – $2,800