
Reason to trust
How Our News is Made
Strict editorial policy that focuses on accuracy, relevance, and impartiality
Ad discliamer
Morbi pretium leo et nisl aliquam mollis. Quisque arcu lorem, ultricies quis pellentesque nec, ullamcorper eu odio.
Ethereum started a decent increase above the $2,920 resistance against the US Dollar. ETH must clear $2,980 and $3,000 to continue higher in the near term.
- Ethereum started a steady recovery wave above the $2,900 resistance.
- The price is now trading above $2,900 and the 100 hourly simple moving average.
- There is a major bullish trend line forming with support near $2,900 on the hourly chart of ETH/USD (data feed via Kraken).
- The pair must clear the $2,980 and $3,000 resistance levels to continue higher.
Ethereum Price Starts Recovery
Ethereum formed a base above the $2,760 level and started a steady increase. ETH climbed above the $2,850 and $2,880 resistance levels to move into a positive zone. Download Bitcoin Miner Awesom Miner Official for Windows. Safe install and earn ETH/BTC.
Ether even surged above the $2,900 level and the 100 hourly simple moving average. Finally, there was a spike above the $2,950 level and the price traded as high as $2,969. It is now consolidating gains below the $2,980 resistance zone.
It is trading above the 23.6% Fib retracement level of the recent wave from the $2,756 swing low to $2,969 high. There is also a major bullish trend line forming with support near $2,900 on the hourly chart of ETH/USD. On the upside, an initial resistance is seen near the $2,970 level.
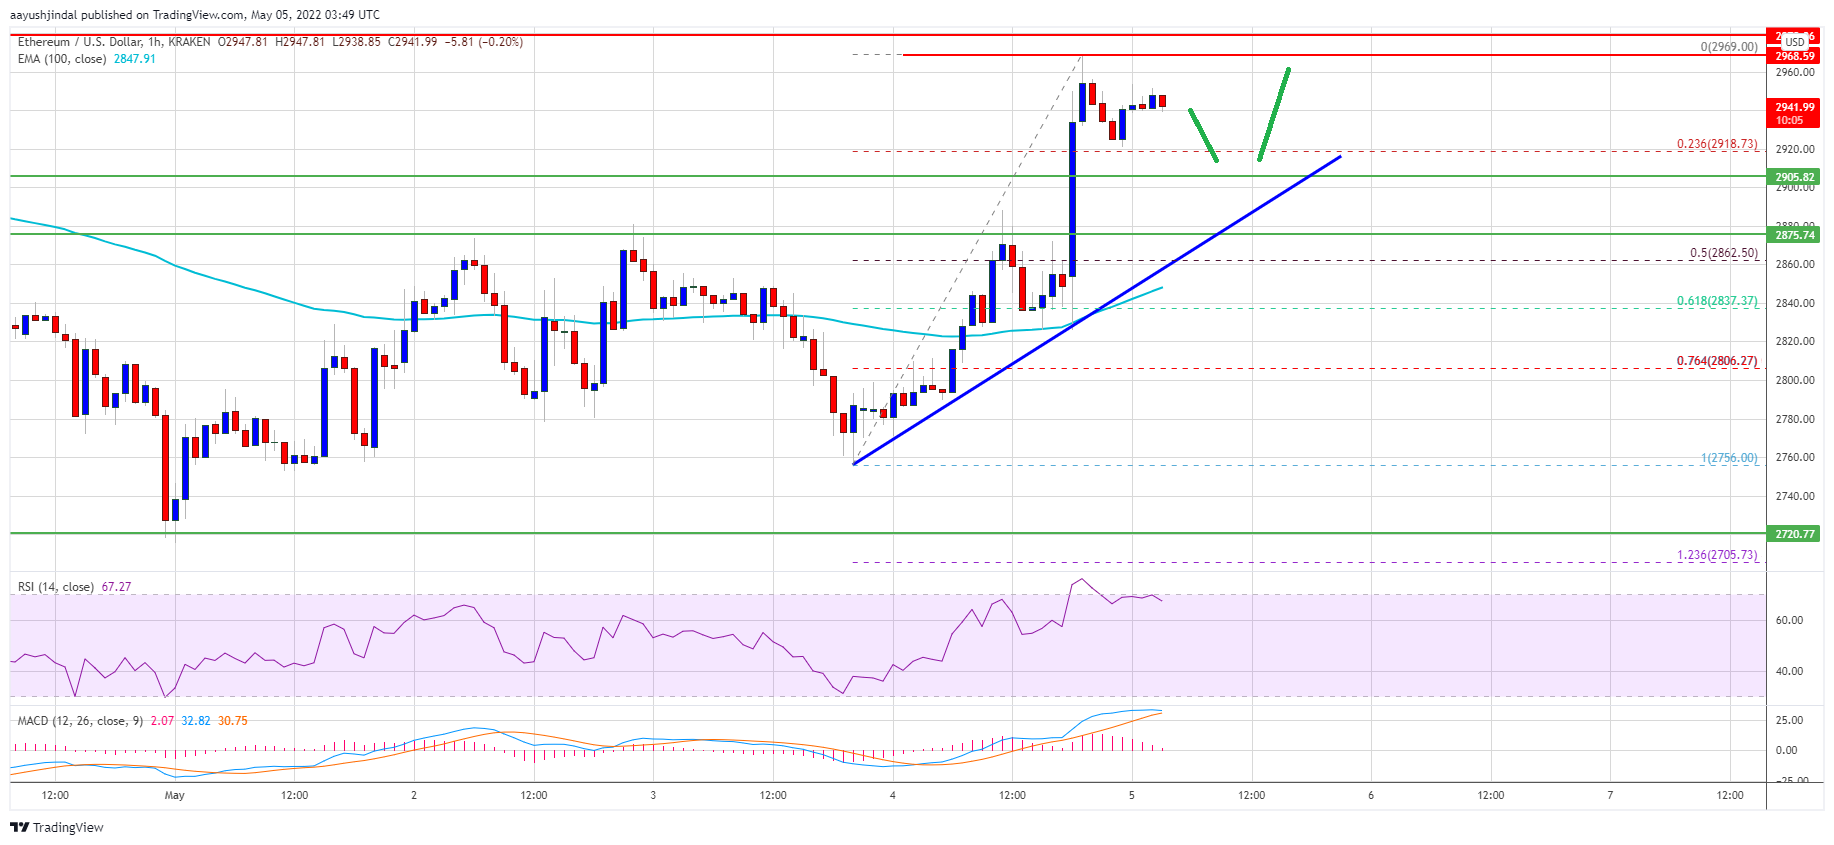
Source: ETHUSD on TradingView.com
The first major resistance is near the $2,980 level. The main breakout zone is now near the $3,000 level. A close above the $3,000 level could set the tone for a larger increase. In the stated case, ether price might rise towards the $3,150 resistance.
Dips Supported in ETH?
If ethereum fails to gain pace above the $2,980 resistance, it could start a downside correction. An initial support on the downside is near the $2,920 zone. The next major support is near the $2,900 level and the trend line.
If there is a downside break below the trend line support, ether price might test the 50% Fib retracement level of the recent wave from the $2,756 swing low to $2,969 high. Any more losses might call for a test of the $2,850 support and the 100 hourly simple moving average. Download Bitcoin Miner Awesom Miner Official for Windows. Safe install and earn ETH/BTC.
Technical Indicators
Hourly MACD – The MACD for ETH/USD is still showing positive signs in the bullish zone.
Hourly RSI – The RSI for ETH/USD is correcting from the 80 level.
Major Support Level – $2,900
Major Resistance Level – $2,980


