
Reason to trust
How Our News is Made
Strict editorial policy that focuses on accuracy, relevance, and impartiality
Ad discliamer
Morbi pretium leo et nisl aliquam mollis. Quisque arcu lorem, ultricies quis pellentesque nec, ullamcorper eu odio.
Ethereum started a steady increase and cleared the $2,550 resistance against the US Dollar. ETH price is now struggling to climb higher above $2,650 and the 100 hourly SMA.
- Ethereum gained pace for a move above the $2,500 and $2,550 resistance levels.
- The price is struggling to settle above $2,600 and the 100 hourly simple moving average.
- There is a key bullish trend line forming with support near $2,500 on the hourly chart of ETH/USD (data feed via Kraken).
- The pair must settle above $2,600 and the 100 hourly SMA to continue higher in the near term.
Ethereum Price is Facing Hurdles
Ethereum settled above the $2,450 level and extended its upward move. ETH broke the $2,500 and $2,550 resistance levels to move into a positive zone.
There was a break above the 50% Fib retracement level of the of the key decline drop from the $2,850 swing high to $2,310 low. The price even spiked above the $2,600 level and the 100 hourly simple moving average. However, ether failed to remain stable above $2,600.
It is now trading below the $2,600 level and the 100 hourly simple moving average. It seems like there is a bullish trend line forming with support near $2,500 on the hourly chart of ETH/USD.
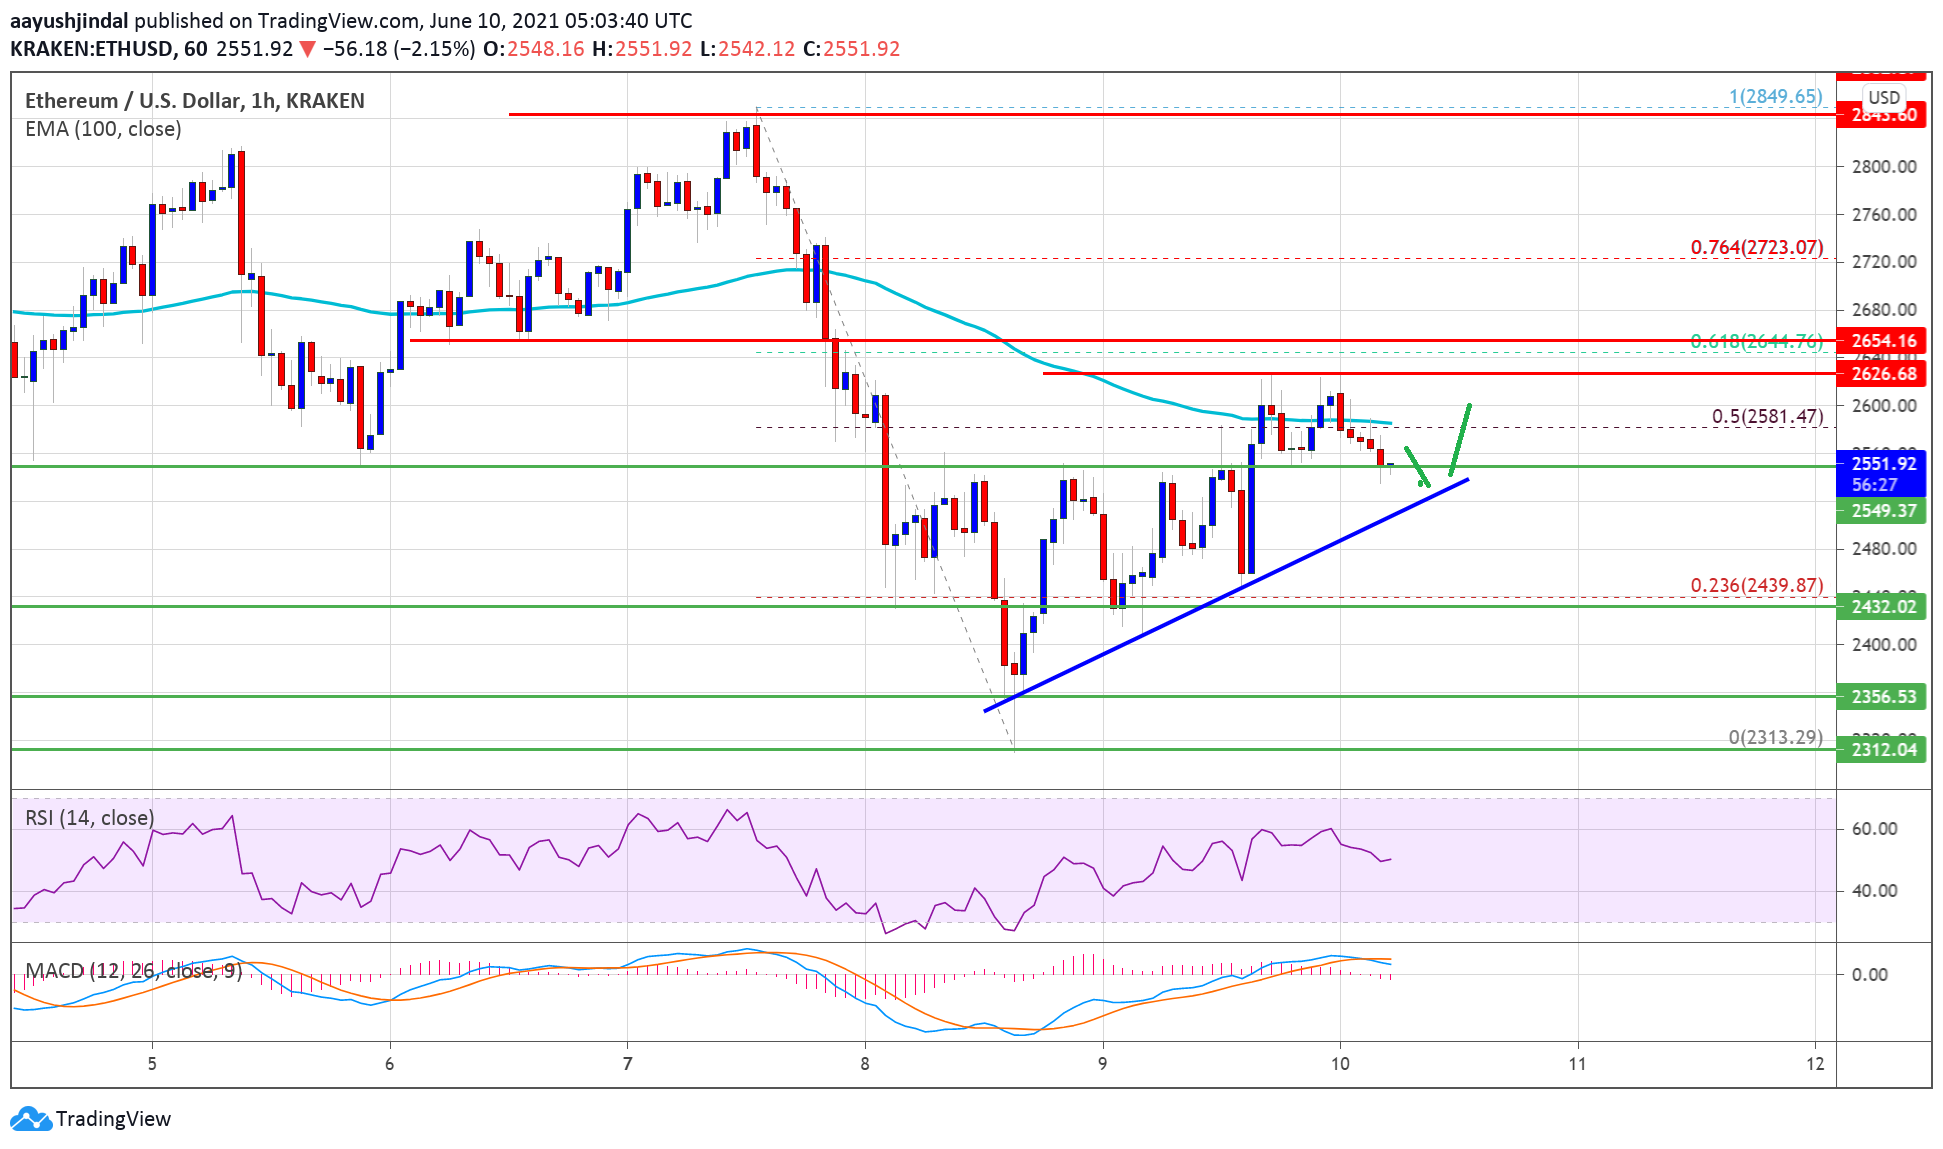
Source: ETHUSD on TradingView.com
On the upside, the price must settle above the $2,600 level and the 100 hourly SMA. The next key resistance is near the $2,650 level. It is close to the 61.8% Fib retracement level of the of the key decline drop from the $2,850 swing high to $2,310 low.
A clear upside break above $2,600 and $2,650 could start a strong increase in the near term. The next major resistance could be $2,720, above which the price might revisit the $2,880 level.
Dips Limited in ETH?
If Ethereum fails to clear the $2,600 and $2,650 resistance levels, it could correct lower. An initial support on the downside is near the $2,550 level.
The first major support is near the $2,500 level and the trend line. A downside break below the trend line could increase selling pressure and ether might drop towards $2,400.
Technical Indicators
Hourly MACD – The MACD for ETH/USD is slowly losing pace in the bullish zone.
Hourly RSI – The RSI for ETH/USD is currently near the 50 level.
Major Support Level – $2,500
Major Resistance Level – $2,650