
Reason to trust
How Our News is Made
Strict editorial policy that focuses on accuracy, relevance, and impartiality
Ad discliamer
Morbi pretium leo et nisl aliquam mollis. Quisque arcu lorem, ultricies quis pellentesque nec, ullamcorper eu odio.
Ethereum declined 5% and it broke the main $400 support against the US Dollar. ETH price is recovering from the $385 support, but it could face hurdles near $400.
- Ethereum is down 5% and it broke the $400 and $395 support levels.
- The price is currently recovering from $385, but it is well below the 100 hourly simple moving average.
- There is a key bearish trend line forming with resistance near $400 on the hourly chart of ETH/USD (data feed via Kraken).
- The pair could resume its decline unless it clears the $400 resistance area in the near term.
Ethereum Price is Down 5%
Yesterday, we discussed the chances of a sharp decline in Ethereum below the $400 support. ETH price did fail to clear the $410 resistance and it declined sharply (unlike bitcoin) below the $400 and $395 support levels.
The decline gained pace below $395 and the price settled below the 100 hourly simple moving average. It tested the $385 support zone and a low is formed near $383. Ether price is currently recovering and trading above the $390 level.
There was a break above the 23.6% Fib retracement level of the recent drop from the $418 high to $383 low. On the upside, the price is facing a lot of hurdles near the $395 and $400 levels.
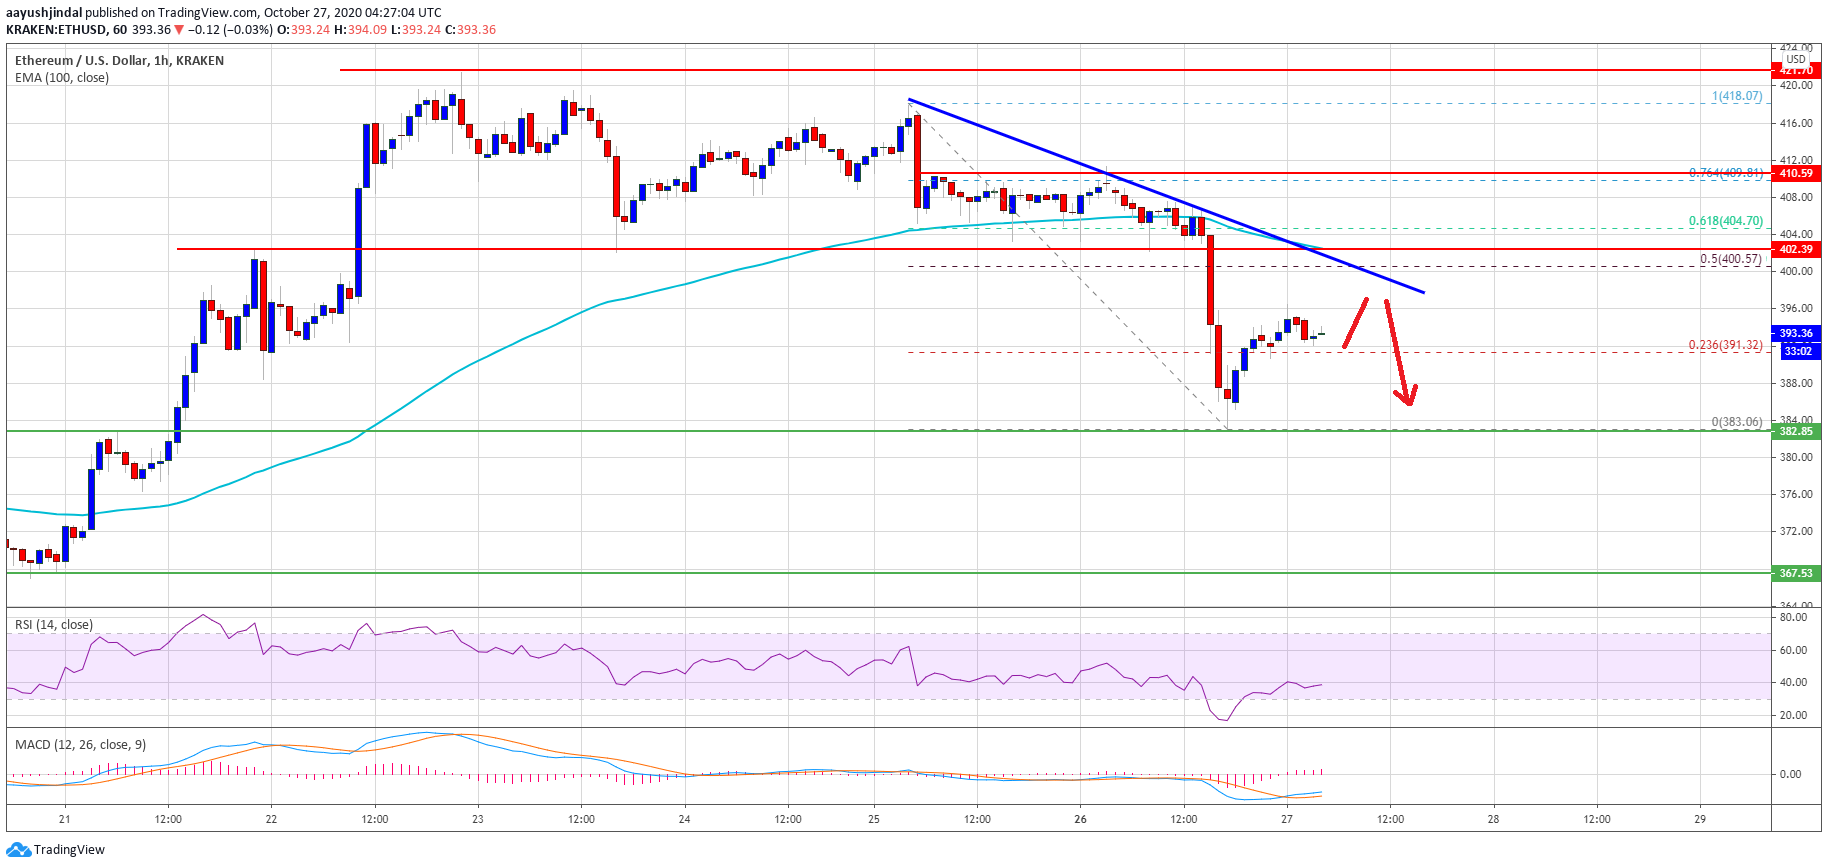
Source: ETHUSD on TradingView.com
There is also a key bearish trend line forming with resistance near $400 on the hourly chart of ETH/USD. The trend line is close to the 100 hourly simple moving average, and the 50% Fib retracement level of the recent drop from the $418 high to $383 low.
To move back into a positive zone, ether price must break the $400 resistance level and settle nicely above the 100 hourly simple moving average. The next stop on the upside could be near the $410 resistance.
More Losses in ETH?
If Ethereum fails to clear the $395 and $400 resistance levels, there is a risk of more losses. An initial support on the downside is near the $388 level.
The main support seems to be forming near the $385 level. A clear break below the $385 support zone could start an extended decline in ether towards the $368 support level in the coming sessions.
Technical Indicators
Hourly MACD – The MACD for ETH/USD is struggling to gain pace in the bullish zone.
Hourly RSI – The RSI for ETH/USD is recovering and close to the 40 level.
Major Support Level – $385
Major Resistance Level – $400