
Reason to trust
How Our News is Made
Strict editorial policy that focuses on accuracy, relevance, and impartiality
Ad discliamer
Morbi pretium leo et nisl aliquam mollis. Quisque arcu lorem, ultricies quis pellentesque nec, ullamcorper eu odio.
Ethereum was able to extend its rally above the $3,500 resistance zone against the US Dollar. ETH price is gaining pace and it might continue to rise towards the $3,800 level.
- Ethereum started a steady increase above the $3,500 and $3,550 resistance levels.
- The price is now trading above $3,500 and the 100 hourly simple moving average.
- There is a major bullish trend line forming with support near $3,490 on the hourly chart of ETH/USD (data feed via Kraken).
- The pair is correcting gains, but dips could be limited below $3,450 in the near term.
Ethereum Price is Rising
Ethereum started a fresh increase after it was able to clear the $3,450 resistance zone. ETH broke the $3,500 resistance zone and the 100 hourly simple moving average to move further into a positive zone.
The upward move was such that the price even climbed above the $3,600 level. A high is formed near $3,620 and the price is now correcting gains, similar to bitcoin. It traded below the $3,600 level. There was a break below the 23.6% Fib retracement level of the recent wave from the $3,361 swing low to $3,620 high.
There is also a major bullish trend line forming with support near $3,490 on the hourly chart of ETH/USD. An immediate resistance on the upside is near the $3,580 level.
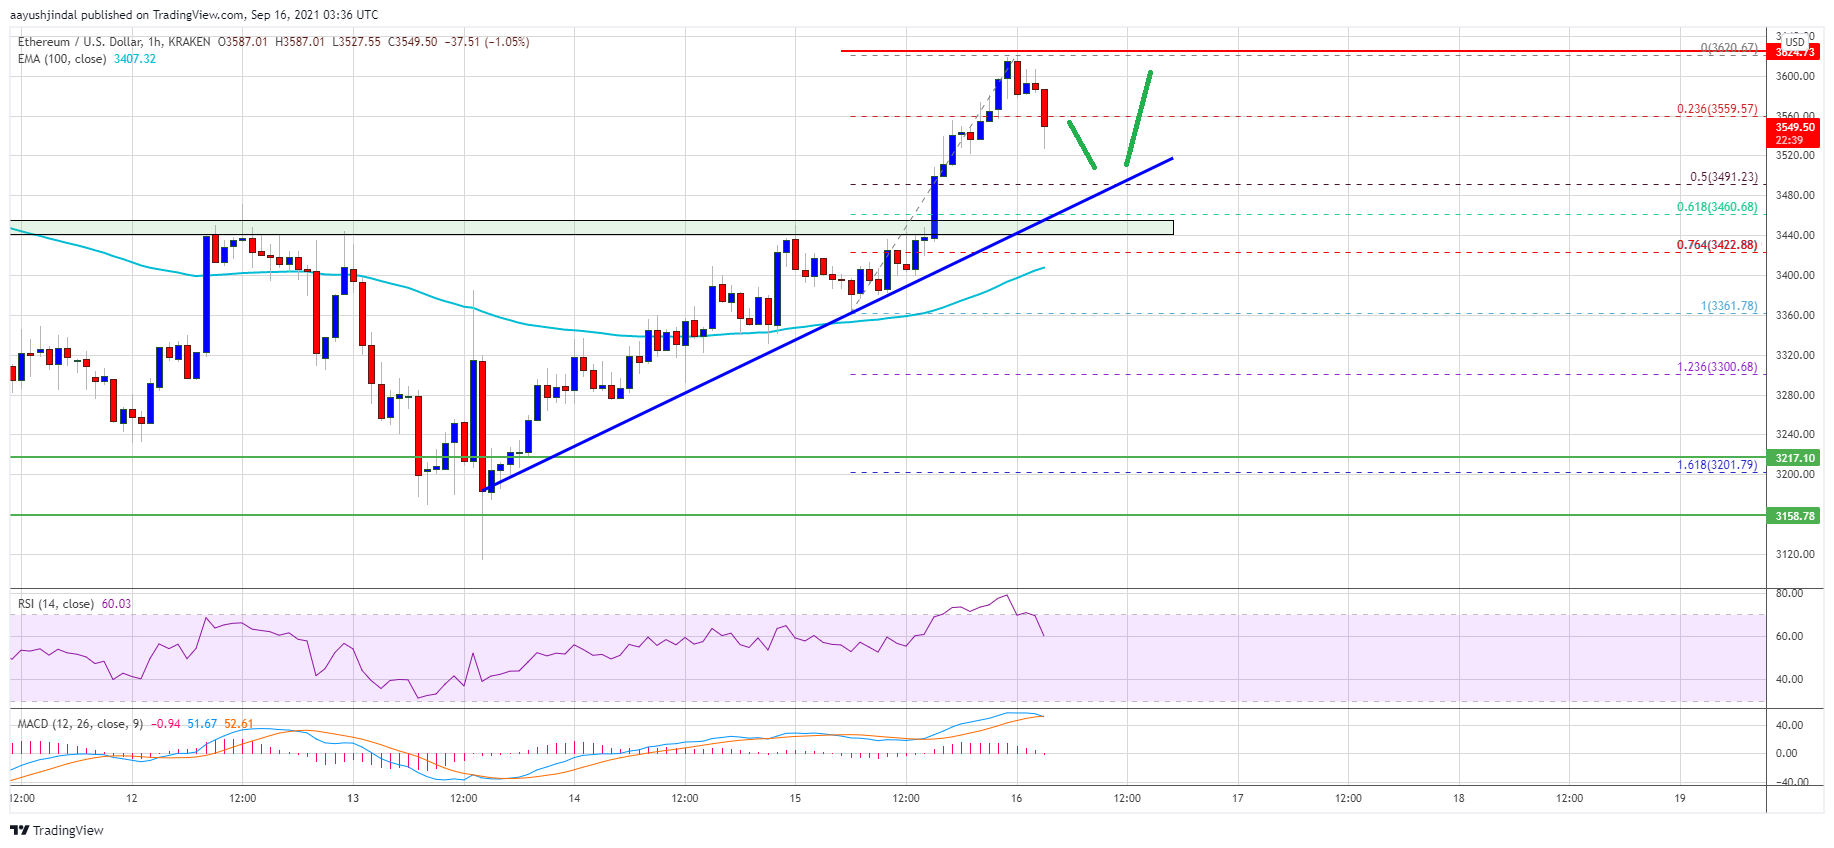
Source: ETHUSD on TradingView.com
The first major resistance is near the $3,600. A clear break and close above the $3,600 level could push the price further higher. The next major resistance sits near $3,720. Any more gains could set the pace for a move towards the $3,800 level.
Dips Limited in ETH?
If ethereum fails to continue higher above the $3,580 and $3,600 resistance levels, it could start a downside correction. An initial support on the downside is near the $3,520 level.
The next major support seems to be forming near the $3,500 level and the trend line. The trend line is close to the 50% Fib retracement level of the recent wave from the $3,361 swing low to $3,620 high. Any more downsides might call for a test of the $3,450 support zone.
Technical Indicators
Hourly MACD – The MACD for ETH/USD is slowly losing pace in the bullish zone.
Hourly RSI – The RSI for ETH/USD is still above the 50 level.
Major Support Level – $3,500
Major Resistance Level – $3,600