
Reason to trust
How Our News is Made
Strict editorial policy that focuses on accuracy, relevance, and impartiality
Ad discliamer
Morbi pretium leo et nisl aliquam mollis. Quisque arcu lorem, ultricies quis pellentesque nec, ullamcorper eu odio.
Ethereum is attempting a recovery wave from the $2,500 support against the US Dollar. ETH price must clear $2,700 and $2,750 to start a strong recovery wave.
- Ethereum found support near $2,500 and started an upside correction.
- The price is now trading below $2,700 and the 100 hourly simple moving average.
- There is a major bearish trend line forming with resistance near $2,690 on the hourly chart of ETH/USD (data feed via Kraken).
- The pair could start a strong recovery wave if it clears the $2,700 and $2,700 resistance levels.
Ethereum Price Faces Resistance
Ethereum extended decline below the $2,550 level and tested the $2,500 zone. ETH formed a base above $2,500 and recently started an upside correction.
There was a move above the $2,580 and $2,600 resistance levels. Ether even climbed above the 50% Fib retracement level of the key decline from the $2,750 swing high to $2,503 low. However, it is still trading below $2,700 and the 100 hourly simple moving average.
An immediate resistance on the upside is near the $2,660 level. It is near the 61.8% Fib retracement level of the key decline from the $2,750 swing high to $2,503 low.
The main resistance is now forming near the $2,700 level and the 100 hourly simple moving average. There is also a major bearish trend line forming with resistance near $2,690 on the hourly chart of ETH/USD. A clear move above the $2,700 might start a steady increase.
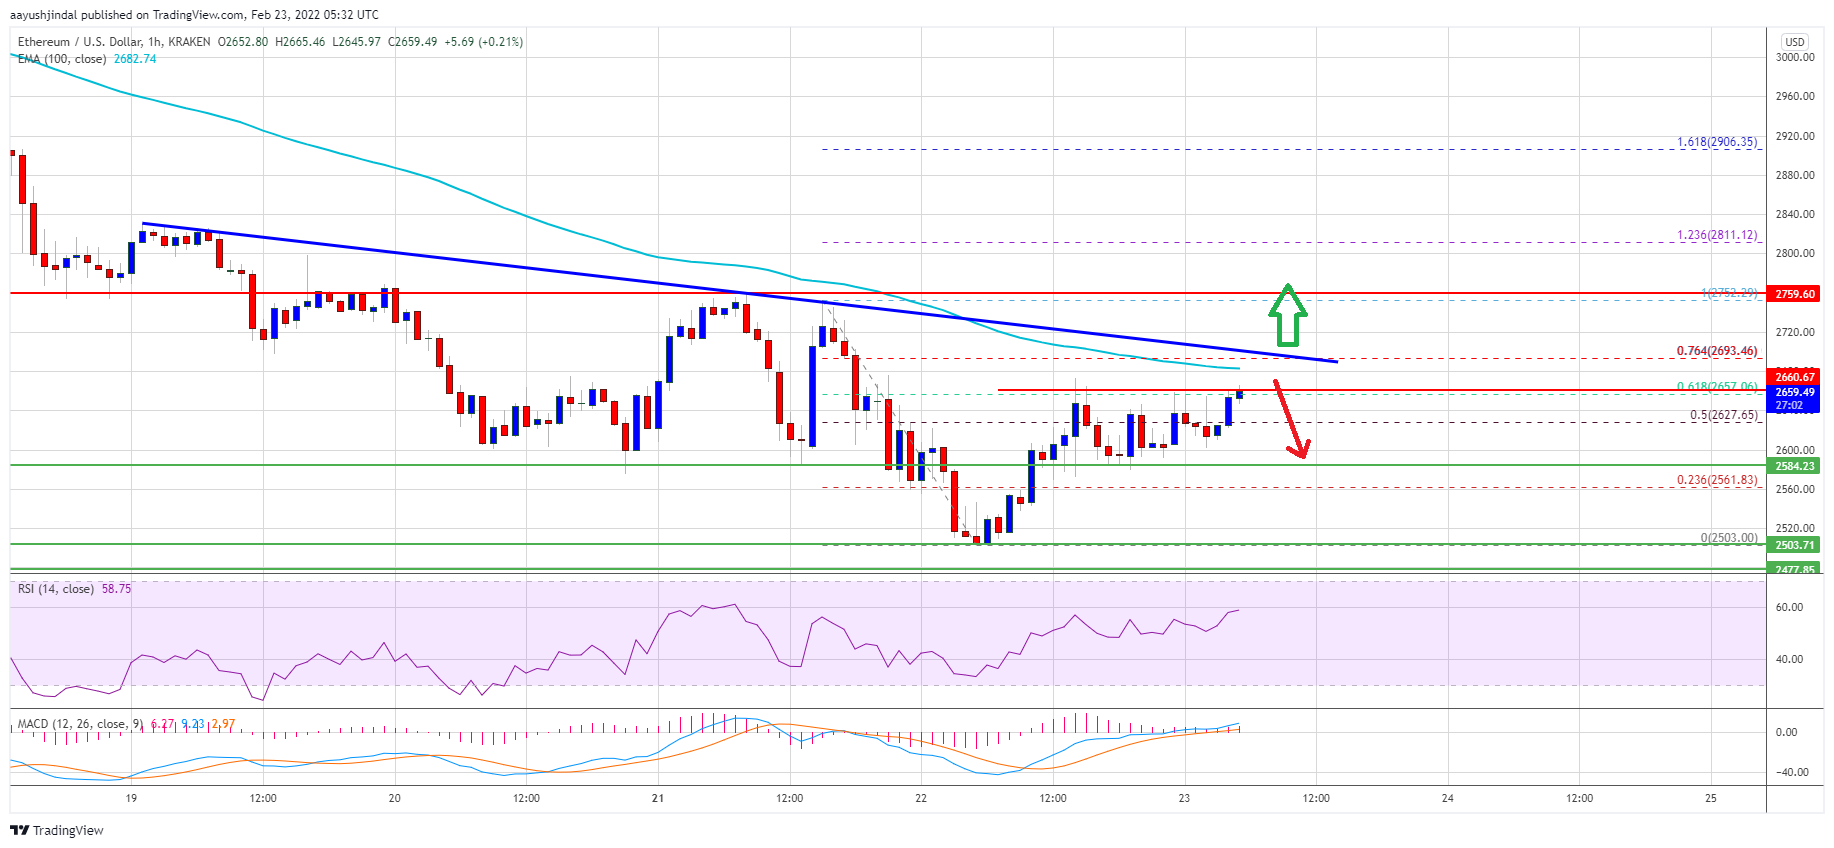
Source: ETHUSD on TradingView.com
The next major resistance could be $2,750, above which the price could gain bullish momentum. In the stated case, the price could rise towards the $2,880 resistance zone.
Fresh Decline in ETH?
If ethereum fails to start a recovery wave above the $2,700 level, it could start another decline. An initial support on the downside is near the $2,600 level.
The next major support is near the $2,585 level. A downside break below the $2,585 support could push the price towards the $2,500 support level. If there are additional losses, the bears might aim a move towards the $2,420 level in the near term.
Technical Indicators
Hourly MACD – The MACD for ETH/USD is slowly gaining pace in the bullish zone.
Hourly RSI – The RSI for ETH/USD is now above the 50 level.
Major Support Level – $2,585
Major Resistance Level – $2,750