
Reason to trust
How Our News is Made
Strict editorial policy that focuses on accuracy, relevance, and impartiality
Ad discliamer
Morbi pretium leo et nisl aliquam mollis. Quisque arcu lorem, ultricies quis pellentesque nec, ullamcorper eu odio.
Ethereum price started an upside correction above $1,850 against the US Dollar. ETH could start another decline if it continues to struggle near $1,900.
- Ethereum is attempting an upside correction above $1,850.
- The price is trading below $1,880 and the 100-hourly Simple Moving Average.
- There is a major bearish trend line forming with resistance near $1,870 on the hourly chart of ETH/USD (data feed via Kraken).
- The pair could continue to move down if it stays below $1,880 and $1,900.
Ethereum Price Faces Resistance
Ethereum’s price managed to stay above the $1,800 support zone. ETH formed a base and recently started an upside correction above $1,850, similar to Bitcoin at $28,000.
The price was able to climb above the 23.6% Fib retracement level of the key drop from the $1,940 swing high to the $1,805 low. However, the price struggled to surpass the $1,880 resistance zone and failed to stay above the 100-hourly Simple Moving Average.
Ether is now trading below $1,880 and the 100-hourly Simple Moving Average. It seems to be facing hurdles near the 50% Fib retracement level of the key drop from the $1,940 swing high to the $1,805 low.
There is also a major bearish trend line forming with resistance near $1,870 on the hourly chart of ETH/USD. The next major resistance seems to be forming near $1,900. A close above the $1,900 level might start a fresh increase. In the stated case, the price could rise toward the $1,950 resistance.
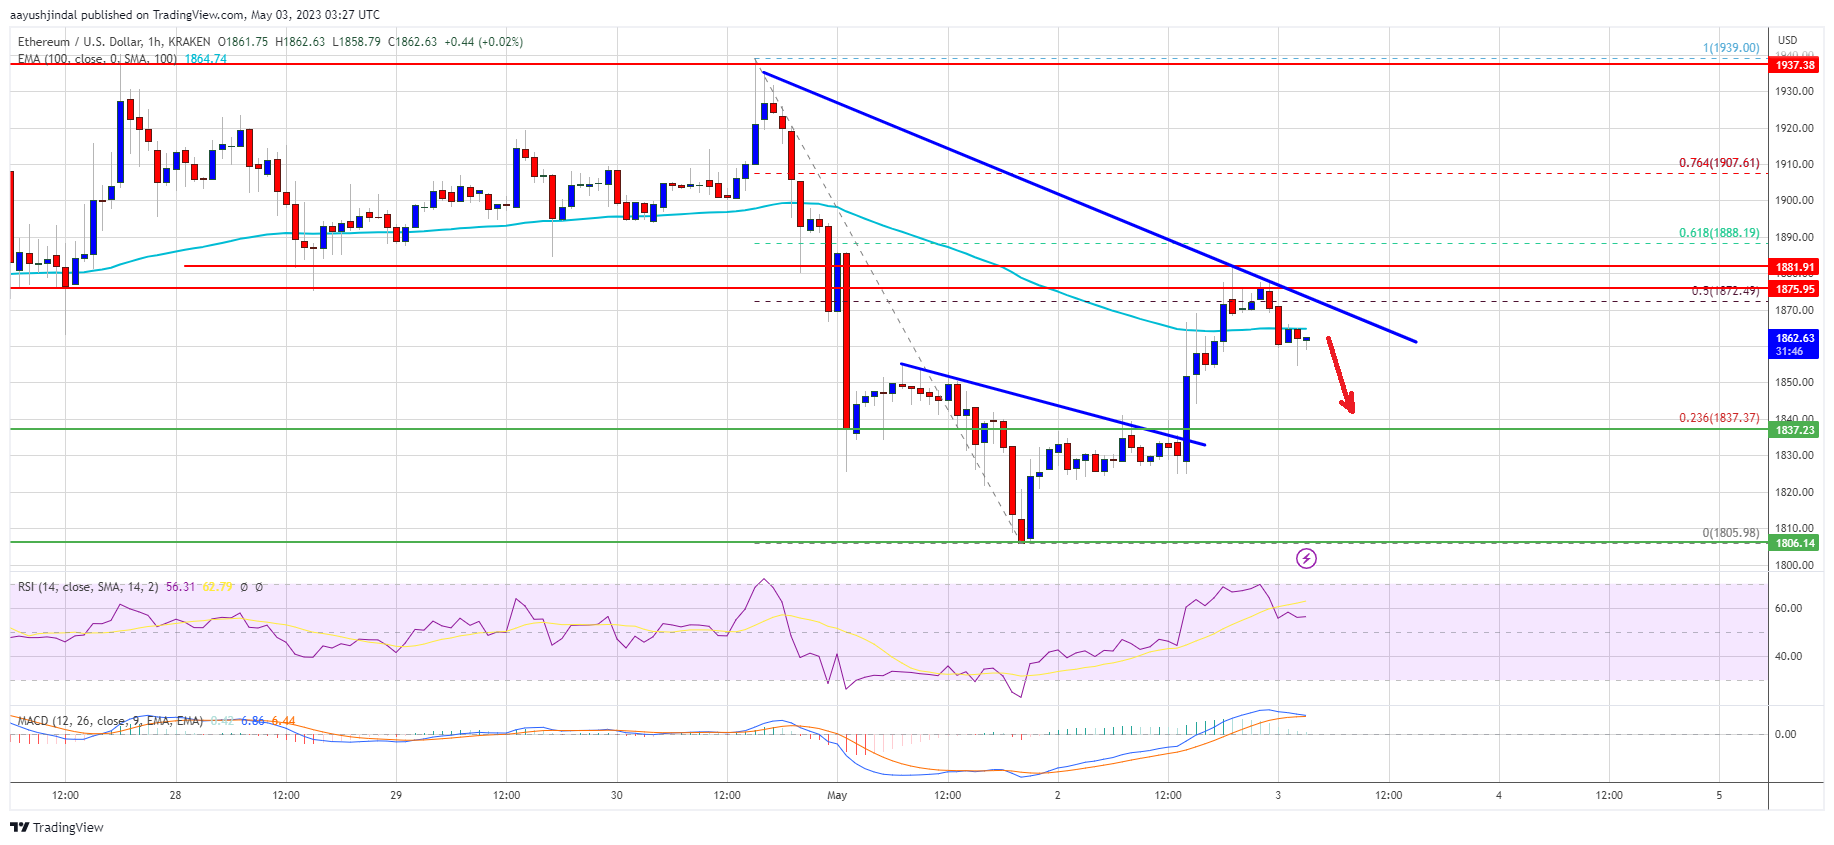
Source: ETHUSD on TradingView.com
Any more gains could send Ether toward the $2,000 resistance. In the stated case, Ether could even attempt a move toward the $2,000 zone, above which the price could gain bullish momentum and even test $2,120.
Fresh Decline in ETH?
If Ethereum fails to clear the $1,880 resistance, it could start another bearish wave. Initial support on the downside is near the $1,840 level.
The next major support is near the $1,800 zone or the last swing low, below which ether price might drop toward the $1,765 support zone. Any more losses may perhaps take the price toward the $1,720 level in the near term.
Technical Indicators
Hourly MACD – The MACD for ETH/USD is now losing momentum in the bullish zone.
Hourly RSI – The RSI for ETH/USD is above the 50 level.
Major Support Level – $1,840
Major Resistance Level – $1,880