
Reason to trust
How Our News is Made
Strict editorial policy that focuses on accuracy, relevance, and impartiality
Ad discliamer
Morbi pretium leo et nisl aliquam mollis. Quisque arcu lorem, ultricies quis pellentesque nec, ullamcorper eu odio.
Ethereum price is correcting gains from the $1,920 resistance against the US Dollar. ETH could start a fresh rally if it clears the $1,920 and $1,930 resistance levels.
- Ethereum is still struggling to clear the $1,920 resistance zone.
- The price is trading above $1,880 and the 100-hourly Simple Moving Average.
- There is a crucial bullish trend line forming with support near $1,890 on the hourly chart of ETH/USD (data feed via Kraken).
- The pair could start a substantial decline if it breaks the $1,870 support.
Ethereum Price Reaches Key Support
Ethereum’s price started a downside correction after it failed to clear the $1,920 resistance zone. ETH corrected lower below the $1,900 level, similar to Bitcoin.
There was a move below the 23.6% Fib retracement level of the key increase from the $1,836 swing low to the $1,930 high. However, the bulls were active above the $1,870 support zone. There is also a crucial bullish trend line forming with support near $1,890 on the hourly chart of ETH/USD.
Ether is now trading above $1,880 and the 100-hourly Simple Moving Average. Immediate resistance is near the $1,920 zone. The next major resistance is near the $1,930 level.
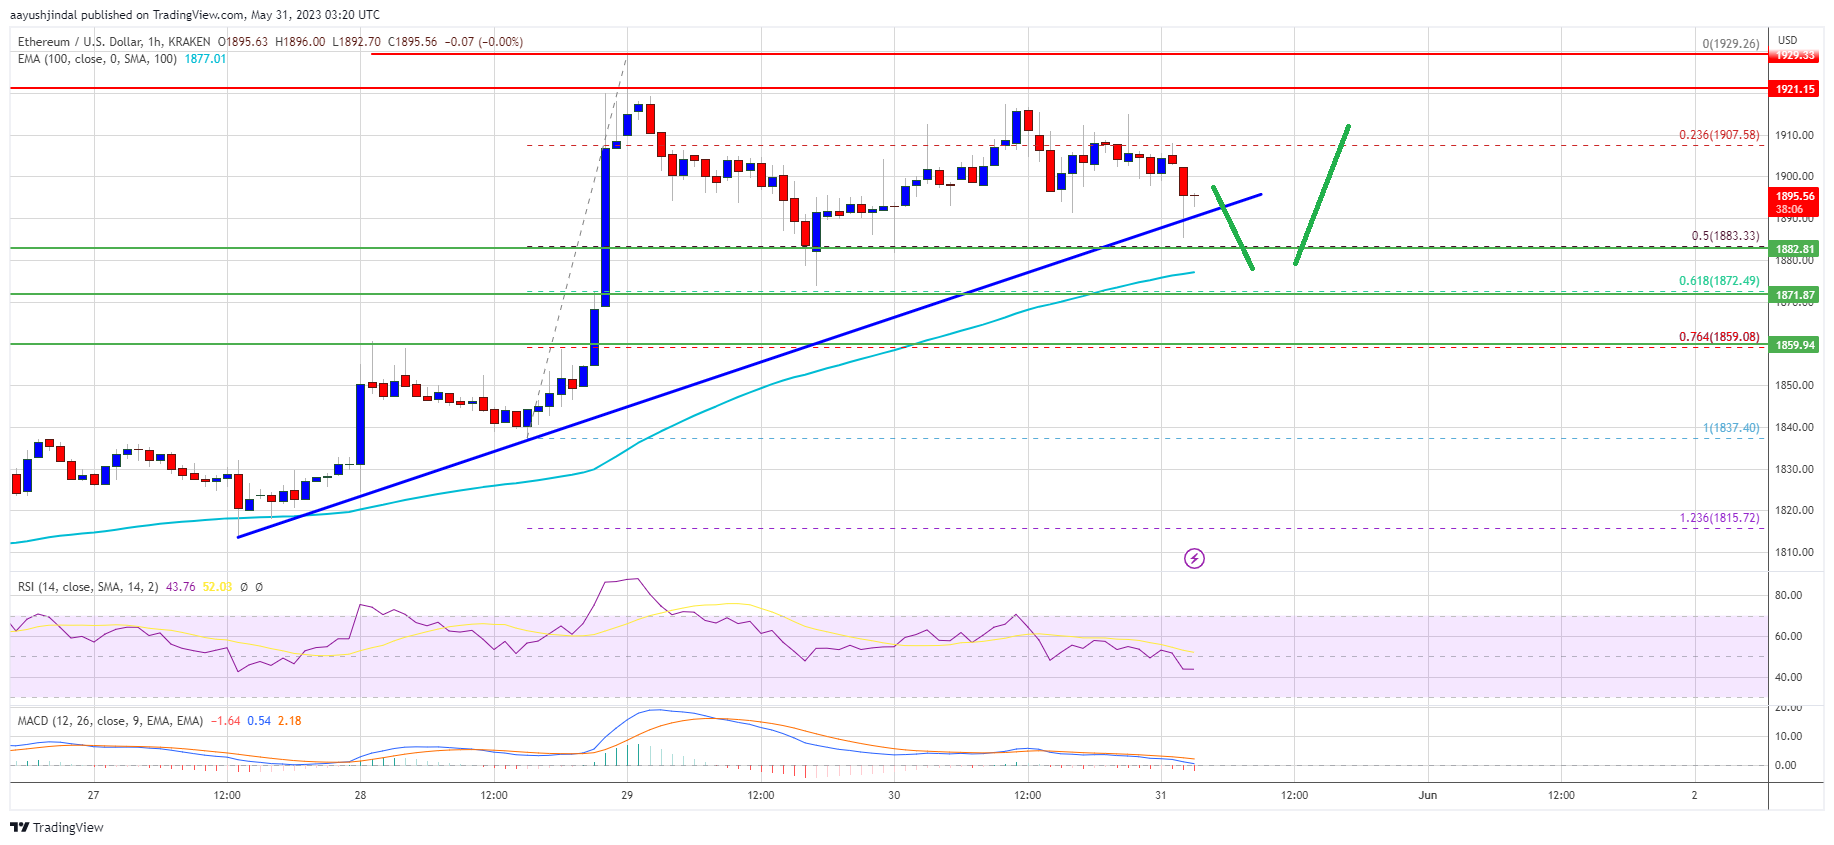
Source: ETHUSD on TradingView.com
A proper move above the $1,920 and $1,930 resistance levels might send Ether toward $2,000. The next resistance sits near $2,050, above which Ethereum could rise toward $2,120. Any more gains above the $2,120 resistance zone might send the price toward the $2,250 resistance. An intermediate resistance might be $2,200.
Downside Break in ETH?
If Ethereum fails to clear the $1,920 resistance, it could continue to move down. Initial support on the downside is near the $1,890 level and the trend line.
The next major support is near the $1,870 zone or the 100-hourly Simple Moving Average. It is close to the 61.8% Fib retracement level of the key increase from the $1,836 swing low to the $1,930 high. If there is a close below the $1,870 support, the price could decline toward the $1,840 support. Any more losses may perhaps send the price toward the $1,800 level or even $1,780 in the coming sessions.
Technical Indicators
Hourly MACD – The MACD for ETH/USD is gaining momentum in the bearish zone.
Hourly RSI – The RSI for ETH/USD is below the 50 level.
Major Support Level – $1,870
Major Resistance Level – $1,920