
Reason to trust
How Our News is Made
Strict editorial policy that focuses on accuracy, relevance, and impartiality
Ad discliamer
Morbi pretium leo et nisl aliquam mollis. Quisque arcu lorem, ultricies quis pellentesque nec, ullamcorper eu odio.
Ethereum price corrected lower and tested the $1,935 support. ETH is likely forming a double-bottom and might start a decent increase.
- Ethereum reacted to the downside and tested the $1,935 support.
- The price is trading below $2,020 and the 100-hourly Simple Moving Average.
- There was a break below a key contracting triangle with support near $2,025 on the hourly chart of ETH/USD (data feed via Kraken).
- The pair is likely forming a double-bottom pattern and might outperform Bitcoin.
Ethereum Price Revisit $1,935
After facing rejection near the $2,090 zone, Ethereum price reacted to the downside. ETH traded below the $2,050 and $2,020 support level to enter a short-term bearish zone, like Bitcoin.
There was also a break below a key contracting triangle with support near $2,025 on the hourly chart of ETH/USD. However, the bulls took a stand near the $1,935 support zone. It seems like Ether is likely forming a double-bottom pattern, while Bitcoin is forming a double-top near $38,000.
Ethereum is now trading above the 23.6% Fib retracement level of the downward move from the $2,092 swing high to the $1,935 low. Immediate resistance is near the $2,000 zone.
The first major resistance is near $2,020 or the 100-hourly Simple Moving Average. It is near the 61.8% Fib retracement level of the downward move from the $2,092 swing high to the $1,935 low. A close above the $2,020 resistance could start another strong increase.
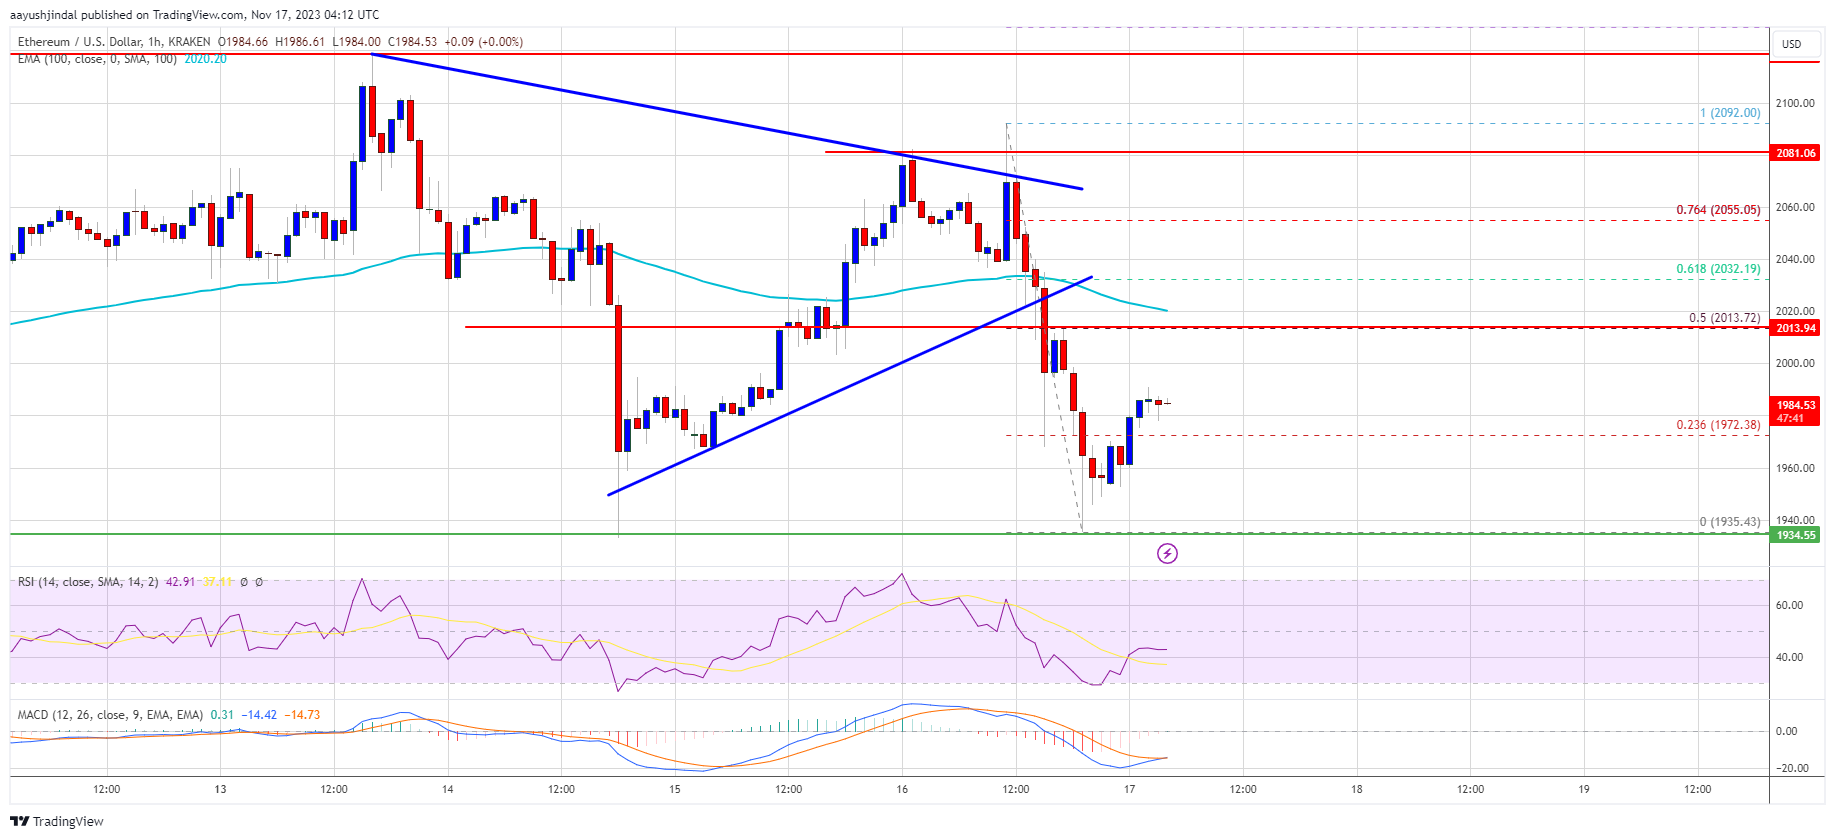
Source: ETHUSD on TradingView.com
The next resistance is near $2,090, above which the price could aim for a move toward the $2,120 level. Any more gains could start a wave toward the $2,200 level.
More Losses in ETH?
If Ethereum fails to clear the $2,020 resistance, it could start a fresh decline. Initial support on the downside is near the $1,950 level. The next key support is $1,935.
The main support is $1,920. A downside break below the $1,920 support might start a steady decline. In the stated case, Ether could drop toward the $1,850 support zone in the near term. Any more losses might call for a drop toward the $1,800 level.
Technical Indicators
Hourly MACD – The MACD for ETH/USD is losing momentum in the bullish zone.
Hourly RSI – The RSI for ETH/USD is now below the 50 level.
Major Support Level – $1,935
Major Resistance Level – $2,020