
Reason to trust
How Our News is Made
Strict editorial policy that focuses on accuracy, relevance, and impartiality
Ad discliamer
Morbi pretium leo et nisl aliquam mollis. Quisque arcu lorem, ultricies quis pellentesque nec, ullamcorper eu odio.
Ethereum price started a steady increase from the $1,520 zone against the US dollar. ETH is now struggling to clear the $1,605 and $1,620 resistance levels.
- Ethereum is attempting a recovery wave above the $1,570 level.
- The price is trading just above $1,575 and the 100-hourly Simple Moving Average.
- There is a key bullish trend line forming with support near $1,572 on the hourly chart of ETH/USD (data feed via Kraken).
- The pair could rise further if there is a close above the $1,620 resistance level.
Ethereum Price Gains Traction
Ethereum started a fresh increase from the $1,520 level. ETH gained traction like Bitcoin and spiked above the $1,600 resistance level. It even climbed above $1,620, but the bears appeared near $1,650.
A high was formed near $1,669 before there was a fresh decline. Ether trimmed gains and settled below the $1,600 level. It tested the $1,575 support and is currently consolidating near the 23.6% Fib retracement level of the recent decline from the $1,669 swing high to the $1,574 low.
Ethereum is now trading just above $1,575 and the 100-hourly Simple Moving Average. There is also a key bullish trend line forming with support near $1,572 on the hourly chart of ETH/USD.
On the upside, the price is facing resistance near the $1,605 level. The first major resistance is near the 50% Fib retracement level of the recent decline from the $1,669 swing high to the $1,574 low at $1,620. A close above the $1,620 resistance might start a decent increase.
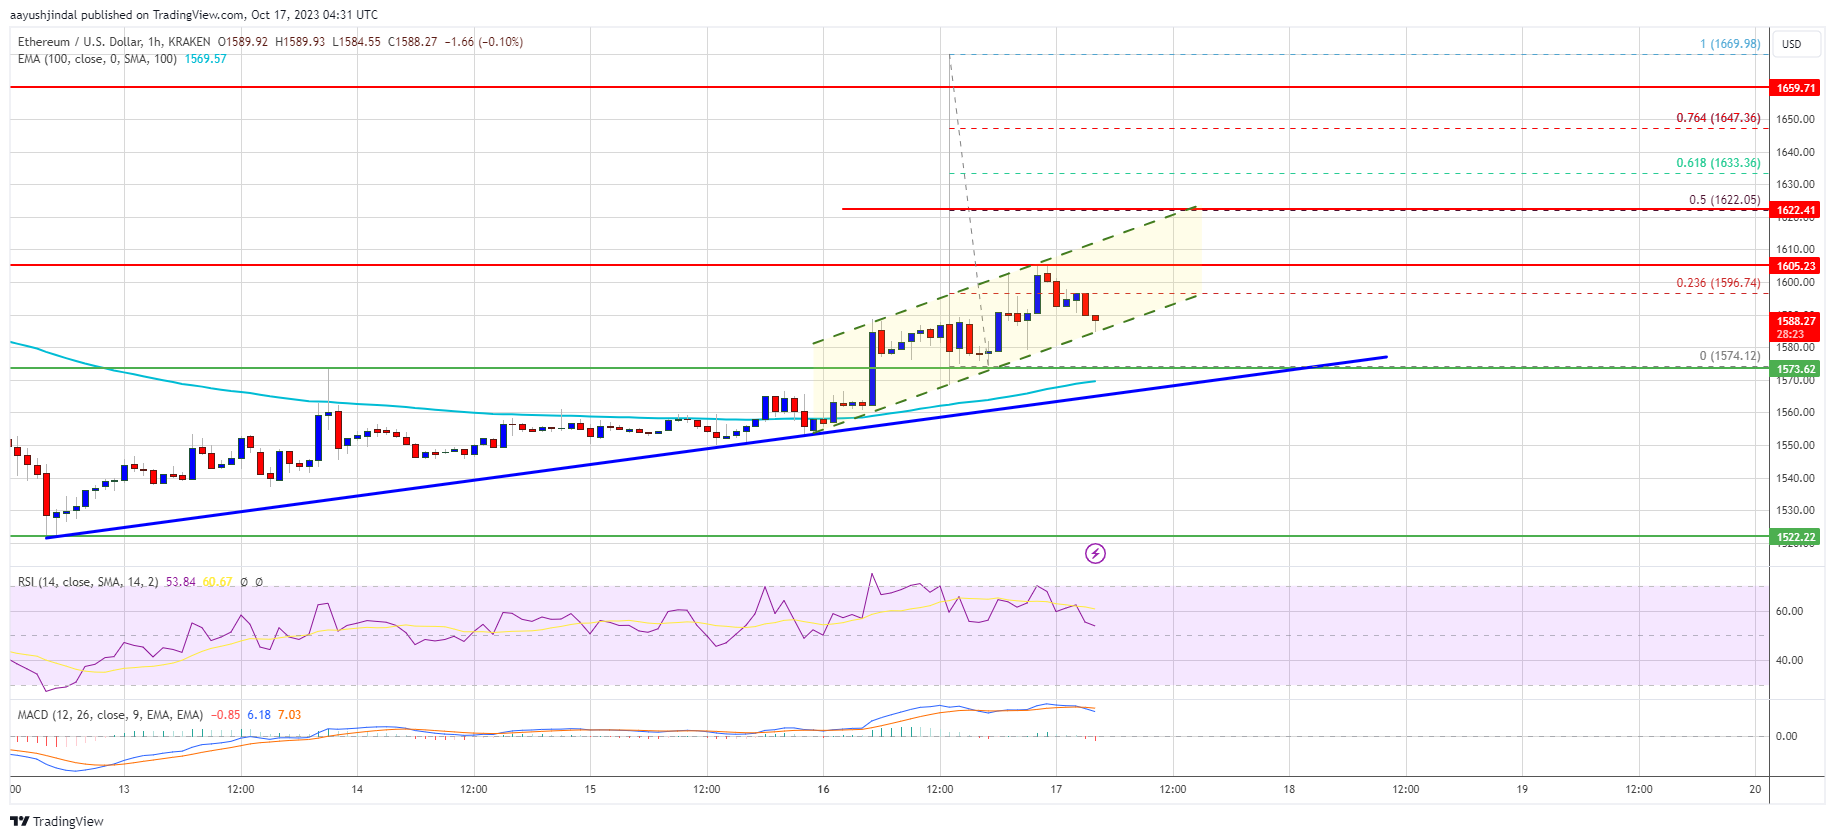
Source: ETHUSD on TradingView.com
In the stated case, Ether could rise and recover toward the $1,665 resistance. Any more gains might open the doors for a move toward $1,750.
Another Decline in ETH?
If Ethereum fails to clear the $1,605 resistance, it could start another decline. Initial support on the downside is near the $1,575 level and the 100-hourly Simple Moving Average.
The next key support is $1,550. A downside break below the $1,550 support might send the price further lower. In the stated case, the price could drop toward the $1,520 level. Any more losses may perhaps send Ether toward the $1,440 level.
Technical Indicators
Hourly MACD – The MACD for ETH/USD is losing momentum in the bullish zone.
Hourly RSI – The RSI for ETH/USD is now above the 50 level.
Major Support Level – $1,575
Major Resistance Level – $1,620