
Reason to trust
How Our News is Made
Strict editorial policy that focuses on accuracy, relevance, and impartiality
Ad discliamer
Morbi pretium leo et nisl aliquam mollis. Quisque arcu lorem, ultricies quis pellentesque nec, ullamcorper eu odio.
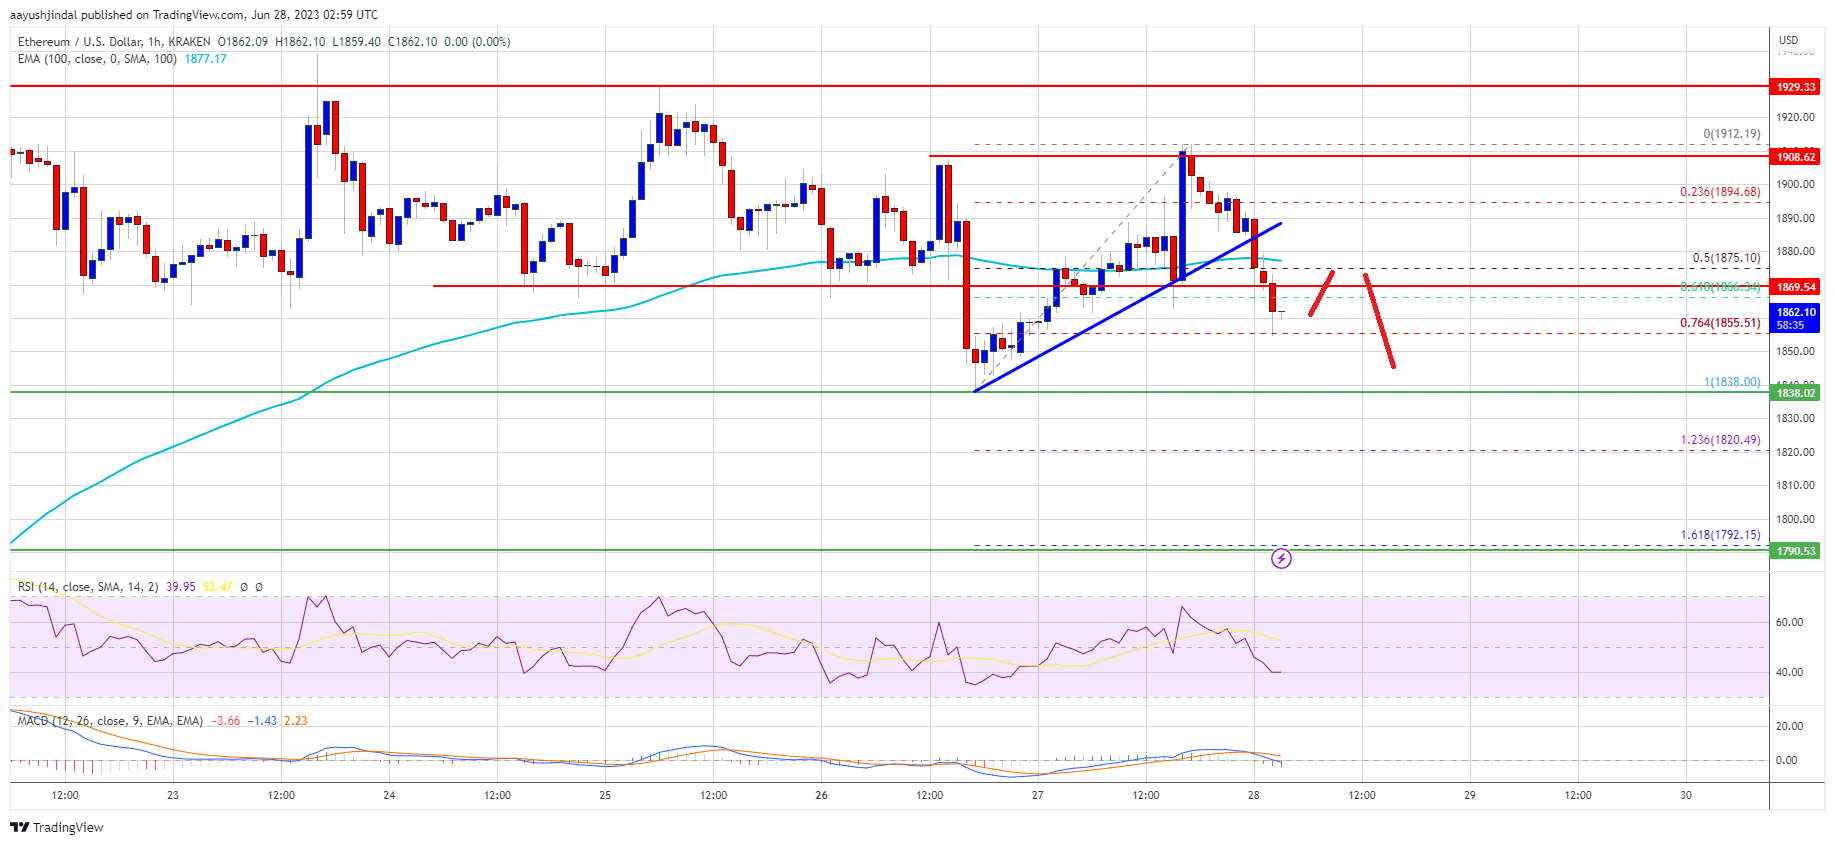
Ethereum price is slowly moving lower from the $1,920 resistance against the US Dollar. ETH could extend its decline toward the $1,790 support.
- Ethereum is still struggling to surpass the $1,920 resistance.
- The price is trading below $1,900 and the 100-hourly Simple Moving Average.
- There was a break below a key bullish trend line with support near $1,885 on the hourly chart of ETH/USD (data feed via Kraken).
- The pair could decline further toward the $1,790 support in the coming sessions.
Ethereum Price Stuck In A Range
Ethereum’s price attempted another upside break above the key $1,920 resistance zone. ETH failed to gain bullish momentum for a close above the $1,920 level, similar to Bitcoin.
A high is formed near $1,912 and the price is now moving lower. There was a break below the $1,900 level. The price declined below the 50% Fib retracement level of the recent increase from the $1,838 low to the $1,912 high. Besides, there was a break below a key bullish trend line with support near $1,885 on the hourly chart of ETH/USD.
Ether is now trading below $1,900 and the 100-hourly Simple Moving Average. It is now testing the 76.4% Fib retracement level of the recent increase from the $1,838 low to the $1,912 high.
If Ethereum stays above $1,850, it could attempt another increase. Immediate resistance is near the $1,880 level or the 100-hourly Simple Moving Average. The next major resistance is near the $1,900 level.
Source: ETHUSD on TradingView.com
The main barrier is still near the $1,920 and $1,930 levels. A close above the $1,930 zone could start a steady increase and send the price further higher. The next resistance sits near $2,000, above which the price could rise toward the $2,050 level. Any more gains could send Ether toward the $2,120 resistance.
More Losses in ETH?
If Ethereum fails to clear the $1,900 resistance, it could continue to move down. Initial support on the downside is near the $1,850 level.
The next major support is near the $1,840 level. If there is a move below $1,840, the price could accelerate lower toward $1,790. Any more losses may perhaps send the price toward the $1,750 support.
Technical Indicators
Hourly MACD – The MACD for ETH/USD is gaining momentum in the bearish zone.
Hourly RSI – The RSI for ETH/USD is now below the 50 level.
Major Support Level – $1,840
Major Resistance Level – $1,900