
Reason to trust
How Our News is Made
Strict editorial policy that focuses on accuracy, relevance, and impartiality
Ad discliamer
Morbi pretium leo et nisl aliquam mollis. Quisque arcu lorem, ultricies quis pellentesque nec, ullamcorper eu odio.
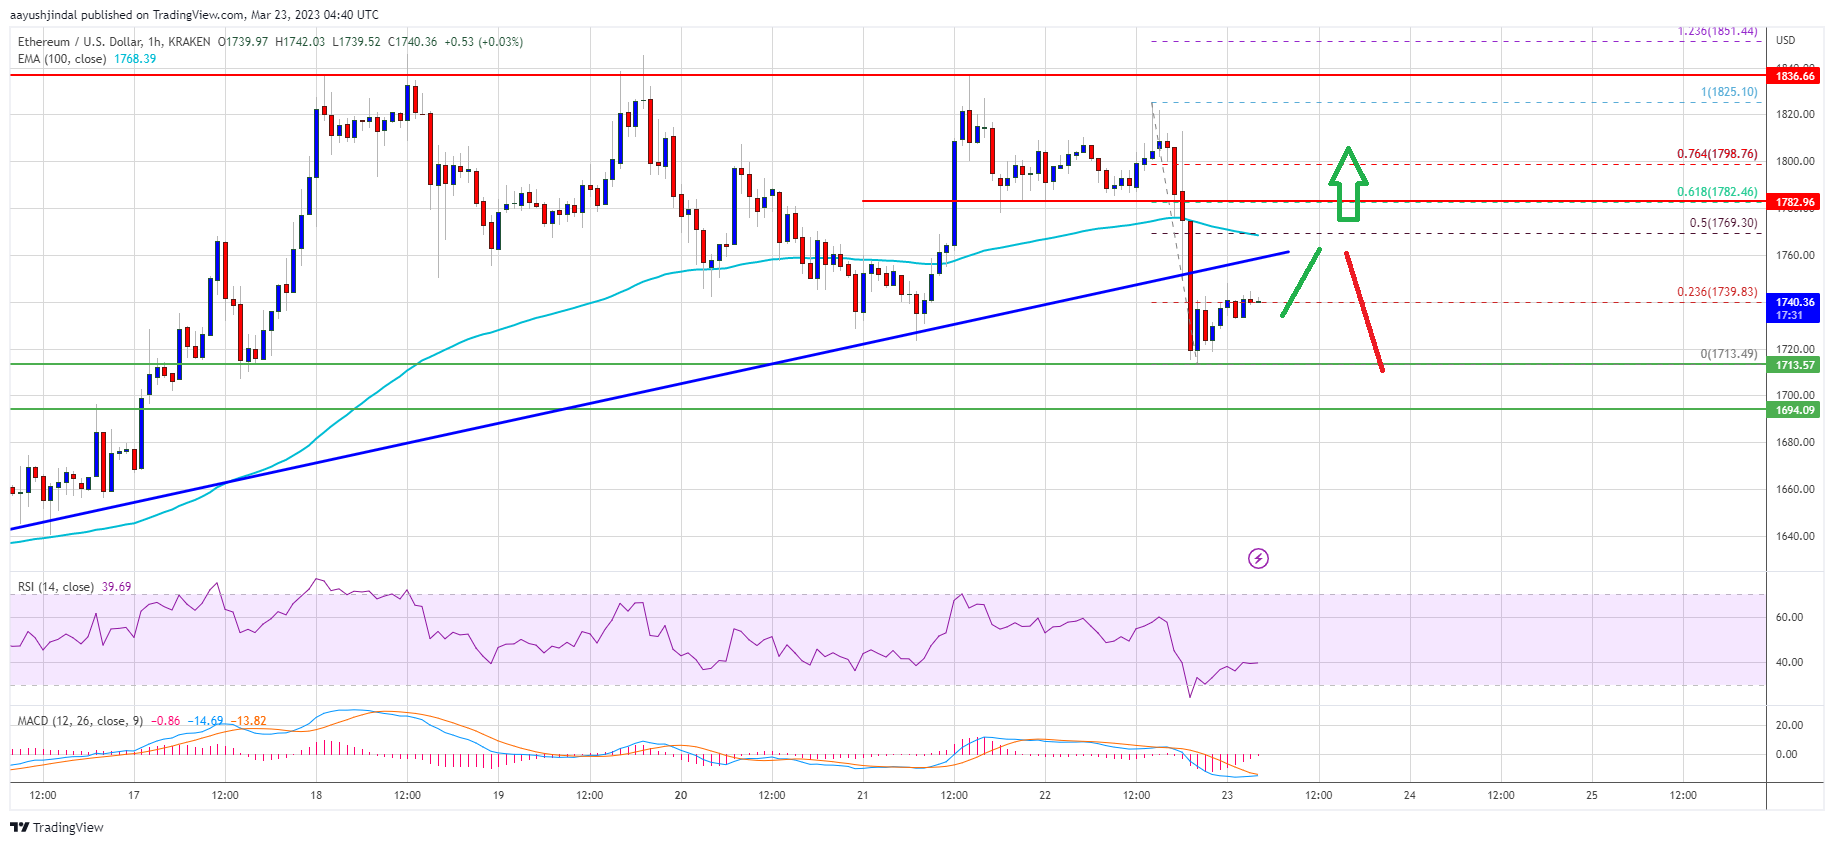
Ethereum price started a downside correction from the $1,840 zone against the US Dollar. ETH is still holding the $1,700 support and might attempt a fresh increase.
- Ethereum reacted to the downside from the key $1,840 resistance zone.
- The price is trading below $1,780 and the 100 hourly simple moving average.
- There was a break below a major bullish trend line with support at $1,750 on the hourly chart of ETH/USD (data feed via Kraken).
- The pair could start a fresh increase if it stays above the key $1,700 support zone.
Ethereum Price Corrects Lower
Ethereum price started a downside correction from the $1,820 resistance zone. ETH corrected lower and traded below the $1,800 level, similar to bitcoin.
The fed increased rates, resulting in a drop below the $1,800 level. There was a break below a major bullish trend line with support at $1,750 on the hourly chart of ETH/USD. The pair declined below the $1,750 support zone. A low is formed near $1,713 and the price is now consolidating losses.
Ether price is now trading below $1,780 and the 100 hourly simple moving average. It is testing the 23.6% Fib retracement level of the downward move from the $1,825 swing high to $1,713 low.
On the upside, the price is facing resistance near the $1,760 zone. The next major resistance is near the $1,770 zone and the 100 hourly simple moving average. It is near the 50% Fib retracement level of the downward move from the $1,825 swing high to $1,713 low.
Source: ETHUSD on TradingView.com
The first major resistance is near $1,800. A close above the $1,800 resistance zone might send the price towards $1,840. If the bulls clear the $1,840 hurdle, there could be a strong upward move.
Downside Break in ETH?
If ethereum fails to clear the $1,770 resistance, it could start another decline. An initial support on the downside is near the $1,720 level.
The next major support is near the $1,695 zone. If there is a break below $1,695, the price might gain bearish momentum and drop towards $1,620. Any more losses might call for a test of the $1,550 level.
Technical Indicators
Hourly MACD – The MACD for ETH/USD is now losing momentum in the bearish zone.
Hourly RSI – The RSI for ETH/USD is now below the 50 level.
Major Support Level – $1,700
Major Resistance Level – $1,770