
Reason to trust
How Our News is Made
Strict editorial policy that focuses on accuracy, relevance, and impartiality
Ad discliamer
Morbi pretium leo et nisl aliquam mollis. Quisque arcu lorem, ultricies quis pellentesque nec, ullamcorper eu odio.
Ethereum price remained strong and started a fresh increase above $2,000. ETH could continue to rise if it clears the $2,075 resistance zone.
- Ethereum is again moving higher above the $2,000 support zone.
- The price is trading above $2,000 and the 100-hourly Simple Moving Average.
- There is a key bullish trend line forming with support near $2,046 on the hourly chart of ETH/USD (data feed via Kraken).
- The pair could accelerate higher if it clears the $2,075 resistance zone in the near term.
Ethereum Price Reclaims $2K
After a downside correction, Ethereum price found support near the $1,920 zone. ETH traded as low as $1,933 and recently started a fresh increase like Bitcoin. There was a clear move above the $1,950 and $1,975 resistance levels.
There was a close above the 50% Fib retracement level of the downward move from the $2,118 swing high to the $1,933 low. Finally, it settled above the main $2,000 resistance zone.
Ethereum is now trading above $2,000 and the 100-hourly Simple Moving Average. There is also a key bullish trend line forming with support near $2,046 on the hourly chart of ETH/USD. Immediate resistance is near the $2,075 zone. It is close to the 76.4% Fib retracement level of the downward move from the $2,118 swing high to the $1,933 low.
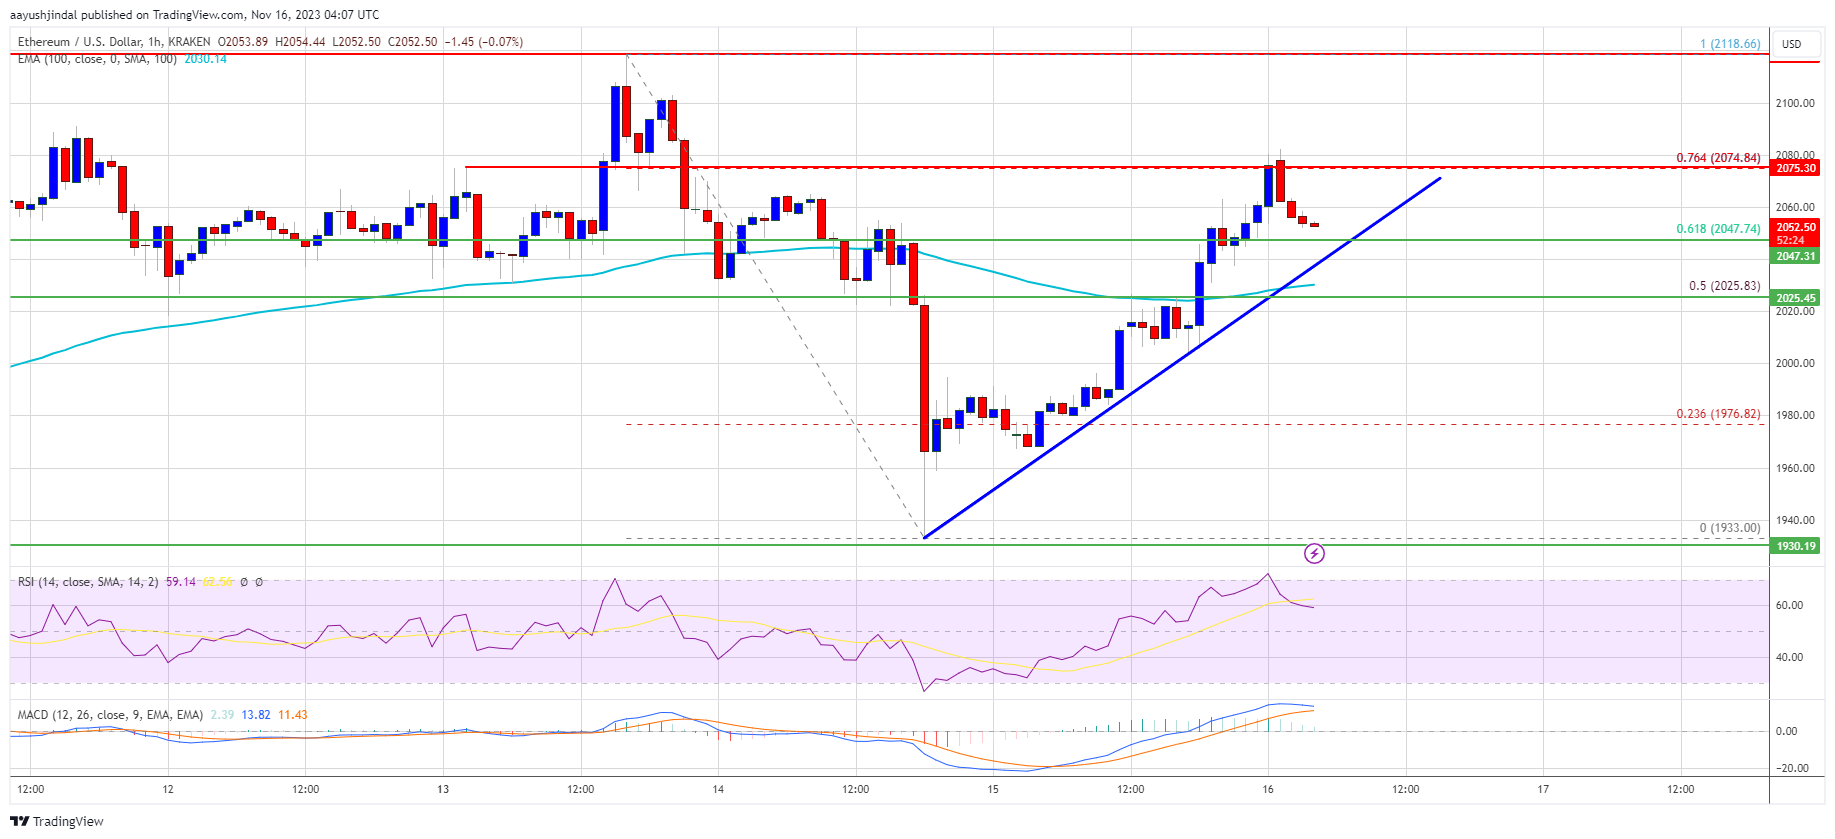
Source: ETHUSD on TradingView.com
The next major resistance sits at $2,120. A close above the $2,120 resistance could start another strong increase. The first resistance is near $2,150, above which the price could aim for a move toward the $2,200 level. Any more gains could start a wave toward the $2,250 level.
More Losses in ETH?
If Ethereum fails to clear the $2,075 resistance or the $2,120 pivot level, it could start a fresh decline. Initial support on the downside is near the $2,045 level or the trend line.
The next key support is $2,025 or the 100-hourly Simple Moving Average. The main support is $2,000. A downside break below the $2,000 support might start a steady decline. In the stated case, Ether could drop toward the $1,920 support zone in the near term. Any more losses might call for a drop toward the $1,850 level.
Technical Indicators
Hourly MACD – The MACD for ETH/USD is losing momentum in the bullish zone.
Hourly RSI – The RSI for ETH/USD is now above the 50 level.
Major Support Level – $2,025
Major Resistance Level – $2,120