
Reason to trust
How Our News is Made
Strict editorial policy that focuses on accuracy, relevance, and impartiality
Ad discliamer
Morbi pretium leo et nisl aliquam mollis. Quisque arcu lorem, ultricies quis pellentesque nec, ullamcorper eu odio.
Ethereum is consolidating gains above $1,600 against the US Dollar. ETH is showing positive signs and might start another increase above $1,650.
- Ethereum is showing positive signs above the $1,620 and $1,600 levels.
- The price is now trading above $1,600 and the 100 hourly simple moving average.
- There is a key bullish flag forming with resistance near $1,640 on the hourly chart of ETH/USD (data feed via Kraken).
- The pair could rally again if it clears the $1,640 and $1,650 resistance levels.
Ethereum Price Could Pop Higher
Ethereum price started a downside correction from the $1,680 resistance zone. ETH corrected lower below the $1,650 and $1,620 level, similar to bitcoin.
The price declined below the 23.6% Fib retracement level of the upward wave from the $1,481 swing low to $1,680 high. There was a sharp decline below the $1,620 level and the 100 hourly simple moving average. However, the price remained stable near the $1,600 level.
Ether price is now trading above $1,600 and the 100 hourly simple moving average. There is also a key bullish flag forming with resistance near $1,640 on the hourly chart of ETH/USD.
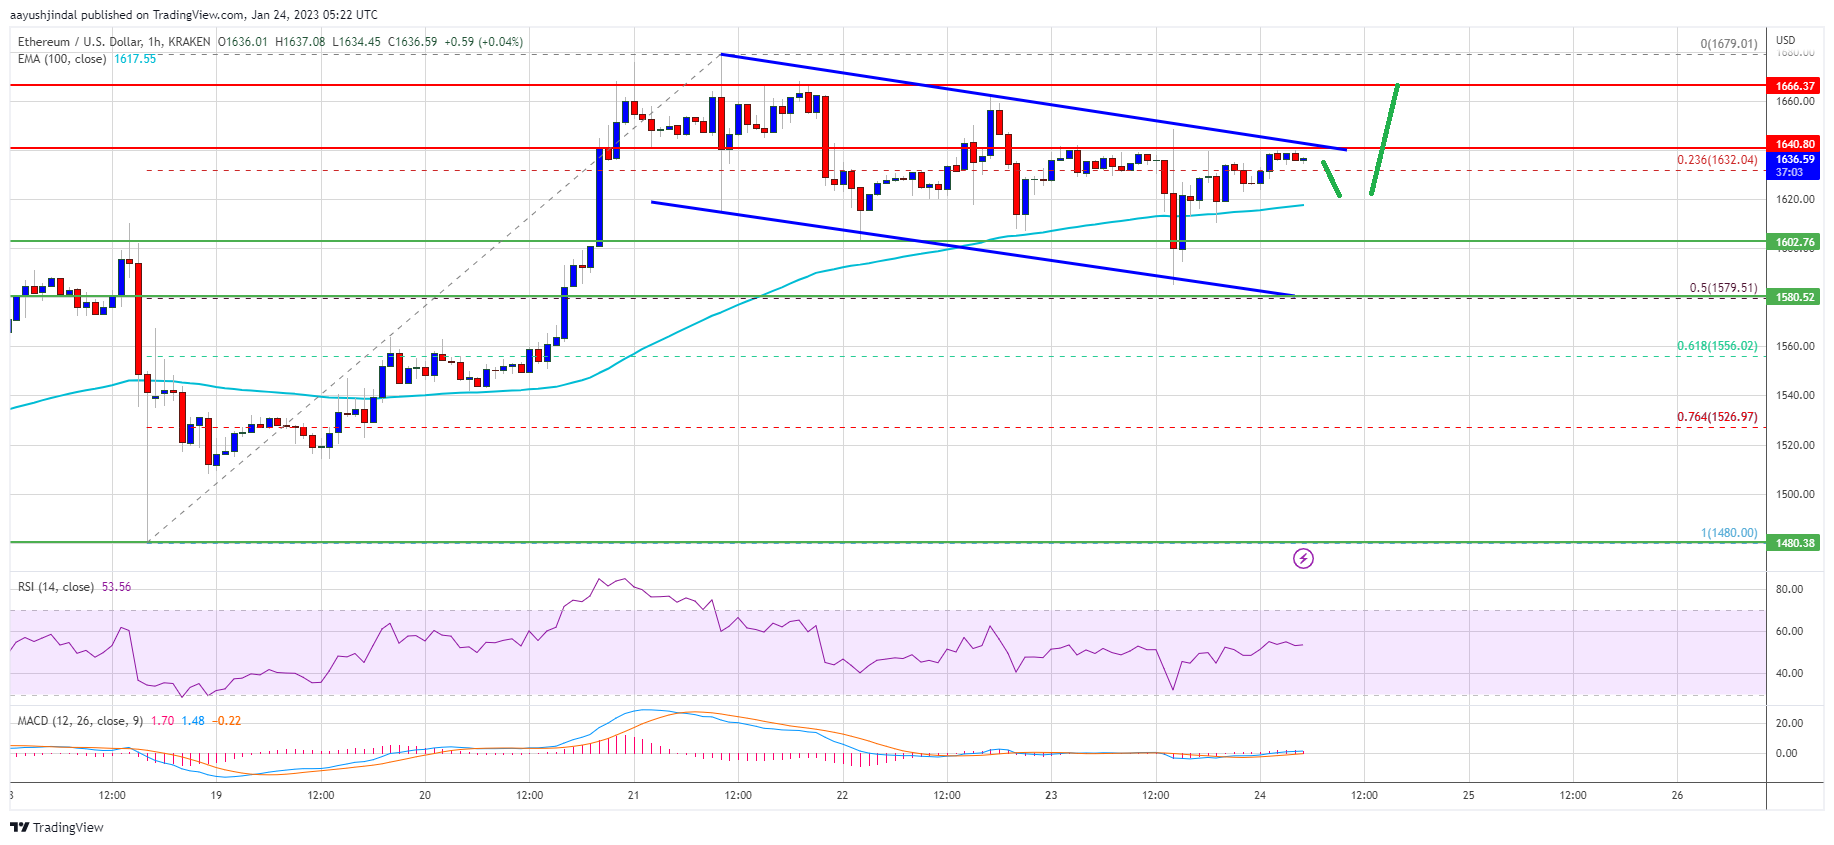
Source: ETHUSD on TradingView.com
An immediate resistance is near the $1,640 level and the channel resistance. The next major resistance is near the $1,665 level. An upside break above the $1,665 resistance zone could start a fresh rally. In the stated case, the price may perhaps rise towards the $1,720 resistance. Any more gains might send the price towards $1,800 or even $1,850 in the near term.
Dips Supported in ETH?
If ethereum fails to clear the $1,640 resistance, it could start another downside correction. An initial support on the downside is near the $1,620 level and the 100 hourly SMA.
The next major support is near the $1,580 level or the 50% Fib retracement level of the upward wave from the $1,481 swing low to $1,680 high. If there is a break below $1,580, the price might drop towards the $1,520 support. Any more losses might call for a test of the $1,500 zone.
Technical Indicators
Hourly MACD – The MACD for ETH/USD is now gaining momentum in the bullish zone.
Hourly RSI – The RSI for ETH/USD is now above the 50 level.
Major Support Level – $1,580
Major Resistance Level – $1,640


