Reason to trust
How Our News is Made
Strict editorial policy that focuses on accuracy, relevance, and impartiality
Ad discliamer
Morbi pretium leo et nisl aliquam mollis. Quisque arcu lorem, ultricies quis pellentesque nec, ullamcorper eu odio.
Ethereum’s ether traded below the $388 and $380 support levels against the US Dollar. ETH price is now testing $372 and it remains at a risk of more downsides.
- Ethereum extended its decline below the $392 and $388 support levels.
- The price is now trading well below $380 and the 100 hourly simple moving average.
- There was a break below a major bullish trend line with support near $391 on the hourly chart of ETH/USD (data feed via Kraken).
- The pair is now testing a crucial breakdown support near the $372-$373 zone.
Ethereum Price is Recovering
After topping near the $404 level, Ethereum started a fresh decline. ETH price broke the $392 and $388 support levels to move into a short-term bearish zone.
More importantly, there was a break below a major bullish trend line with support near $391 on the hourly chart of ETH/USD. It opened the doors for more losses below the $380 support and the 100 hourly simple moving average. Similarly, there was a fresh decline in bitcoin price below the $13,500 support zone.
Ether price even declined below the 76.4% Fib retracement level of the upward move from the $373 swing low to $404 swing high. It is now trading near a crucial breakdown support near the $372-$373 zone.
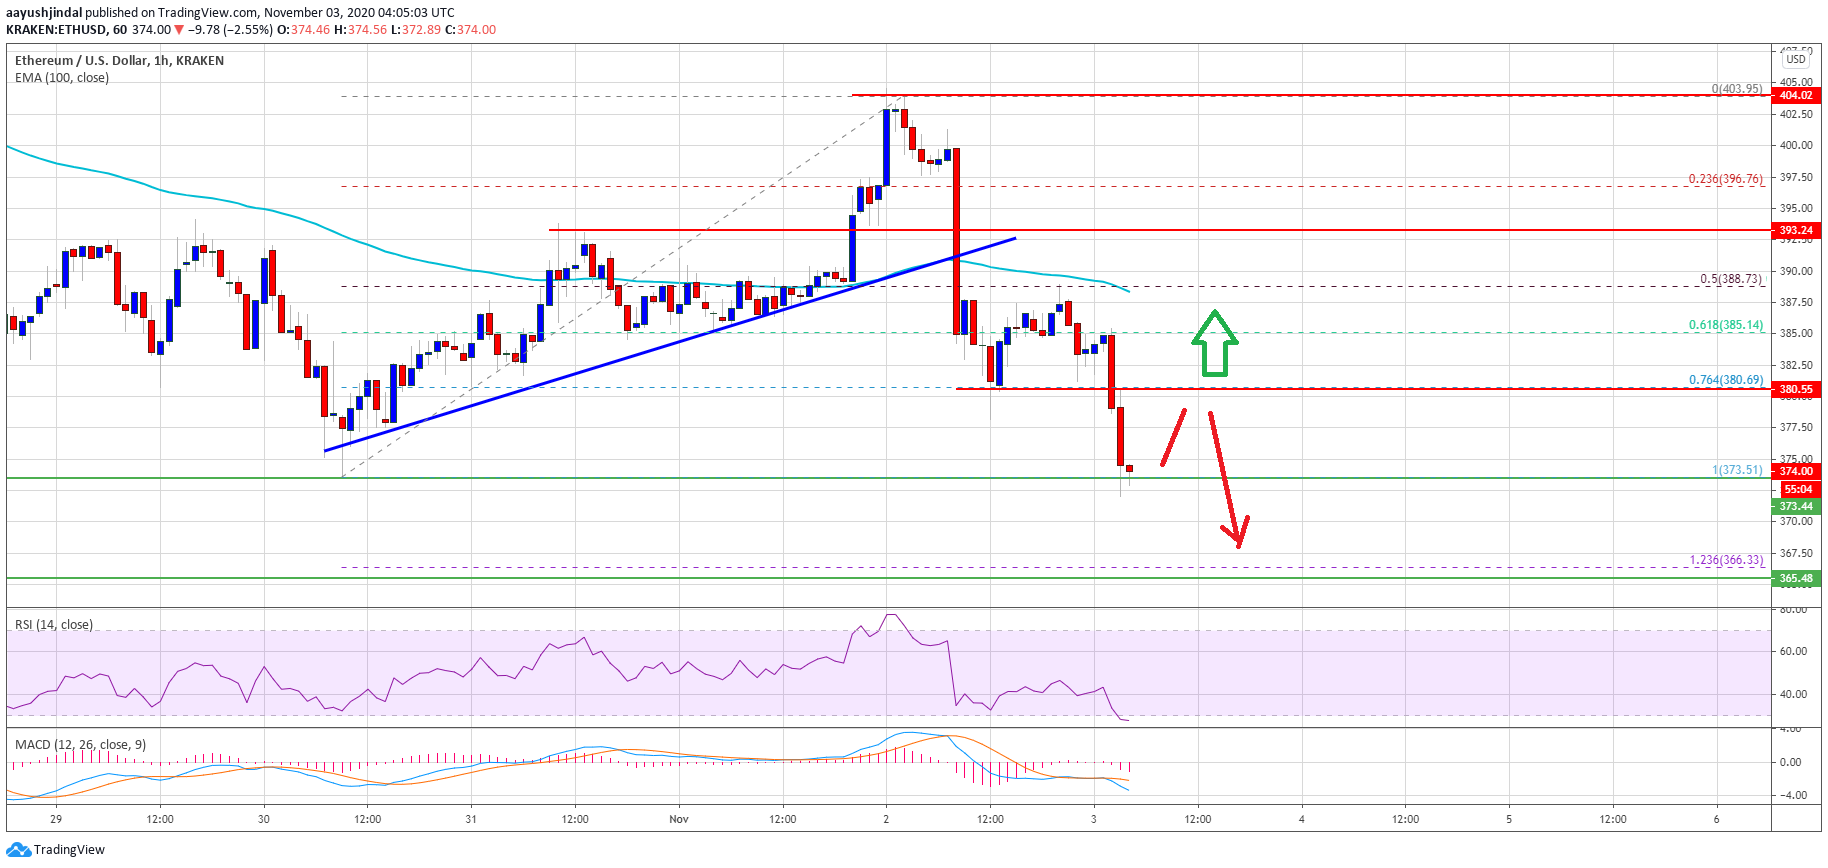
Source: ETHUSD on TradingView.com
If there is a downside break below the $372-$373 support zone, the price could continue to move down towards the $366 and $365 support levels. The 1.236 Fib extension level of the upward move from the $373 swing low to $404 swing high is also near the $366 level.
Any further losses below the $366 and $365 support levels may perhaps clear the path for an extended decline towards the $355 support in the coming sessions. The next major support is near the $350 level.
Upsides Capped in ETH?
If Ethereum starts an upside correction, the previous support near the $380 level is likely to act as a hurdle for the bulls. The next major resistance is near the $385 level.
The main resistance for the bulls is forming near the $388 level and the 100 hourly simple moving average, above which ether price could test or even break the $400 resistance zone.
Technical Indicators
Hourly MACD – The MACD for ETH/USD is slowly losing momentum in the bullish zone.
Hourly RSI – The RSI for ETH/USD is still well above the 60 level.
Major Support Level – $392
Major Resistance Level – $402