
Reason to trust
How Our News is Made
Strict editorial policy that focuses on accuracy, relevance, and impartiality
Ad discliamer
Morbi pretium leo et nisl aliquam mollis. Quisque arcu lorem, ultricies quis pellentesque nec, ullamcorper eu odio.
Ethereum extended decline below the $2,500 support zone against the US Dollar. ETH price is recovering, but it must clear $2,680 to start a decent increase.
- Ethereum extended decline below the $2,500 support before correcting higher.
- The price is now trading below $2,600 and the 100 hourly simple moving average.
- There is a key bearish trend line forming with resistance near $2,600 on the hourly chart of ETH/USD (data feed via Kraken).
- The pair could start a steady recovery wave if it clears $2,600 and $2,680.
Ethereum Price Faces Hurdle
Ethereum remained in a bearish zone below the $2,650 level. ETH even extended decline below the $2,500 support level and settled below the 100 hourly simple moving average.
A low was formed near $2,445 and the price is now correcting losses. There was a move above the $2,500 resistance level. Ether price even spiked above the 50% Fib retracement level of the recent decline from the $2,648 swing high to $2,445 low.
However, the bears remained active near the $2,570 level. It is near the 61.8% Fib retracement level of the recent decline from the $2,648 swing high to $2,445 low.
The first major resistance is seen near the $2,600 level (the recent breakdown zone). There is also a key bearish trend line forming with resistance near $2,600 on the hourly chart of ETH/USD. The next major resistance might be near the 100 hourly simple moving average and the $2,680 level.
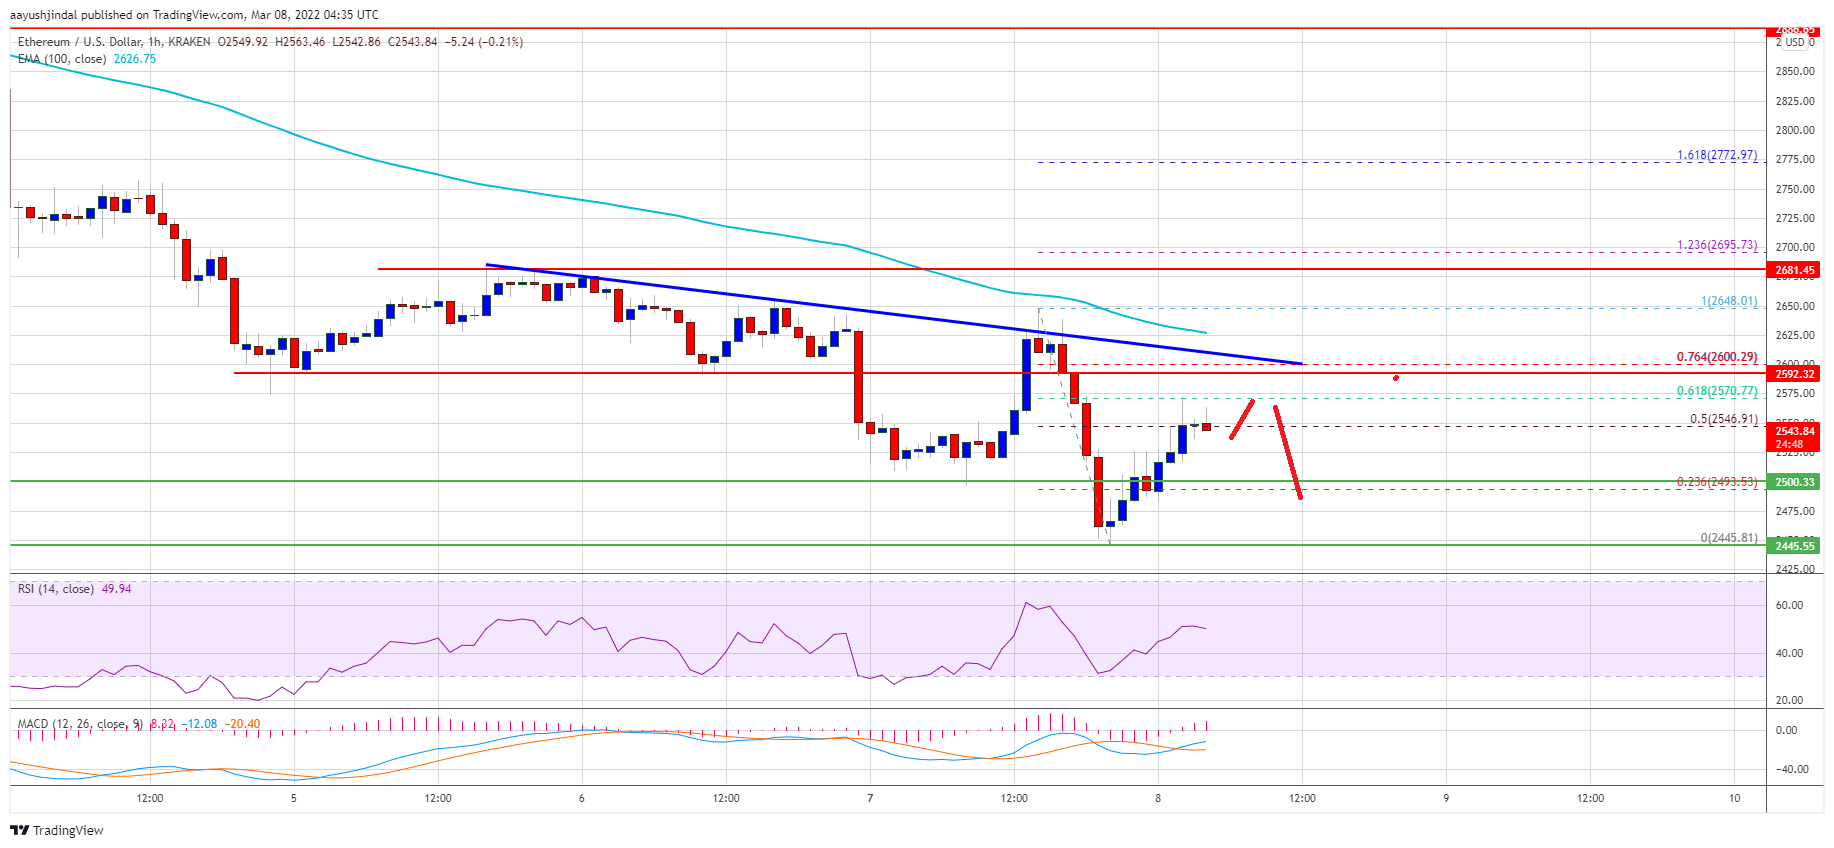
Source: ETHUSD on TradingView.com
A close above the 100 hourly SMA and then $2,680 might start a steady increase. In the stated case, the price might rise towards $2,800 or even $2,880.
More Downsides in ETH?
If ethereum fails to start a fresh increase above the $2,600 level, it could start another decline. An initial support on the downside is near the $2,500 level.
The next major support is near the $2,445 low, below which the price might gain bearish momentum. In the stated case, ether price could decline towards the $2,400 support zone. Any more losses might call for a move towards the $2,300 level in the near term.
Technical Indicators
Hourly MACD – The MACD for ETH/USD is now gaining pace in the bullish zone.
Hourly RSI – The RSI for ETH/USD is now above the 50 level.
Major Support Level – $2,500
Major Resistance Level – $2,680