
Reason to trust
How Our News is Made
Strict editorial policy that focuses on accuracy, relevance, and impartiality
Ad discliamer
Morbi pretium leo et nisl aliquam mollis. Quisque arcu lorem, ultricies quis pellentesque nec, ullamcorper eu odio.
Ethereum started a downside correction below the $460 support level against the US Dollar. ETH price is now trading below $450 and it remains at a risk of more downsides.
- Ethereum is showing a few bearish signs below the $460 and $455 support levels.
- The price is now trading well below $460 level the 100 hourly simple moving average.
- There is a key bearish trend line forming with resistance near $453 on the hourly chart of ETH/USD (data feed via Kraken).
- The pair could accelerate lower if there is a clear break below the $442 and $440 support levels.
Ethereum Price is Facing Hurdles
Ethereum started a downside correction after it failed to clear the $480 resistance zone. ETH price broke the $465 and $460 support levels to move into a short-term bearish zone.
There was also a close below the $460 level and the 100 hourly simple moving average. Ether price extended its decline below the $450 support and tested the $440 level. A low is formed near $440 and the price is currently correcting higher.
It surpassed the $445 level, plus there was a break above the 23.6% Fib retracement level of the recent decline from the $462 high to $440 low. The price is now approaching the $450-$452 resistance zone.
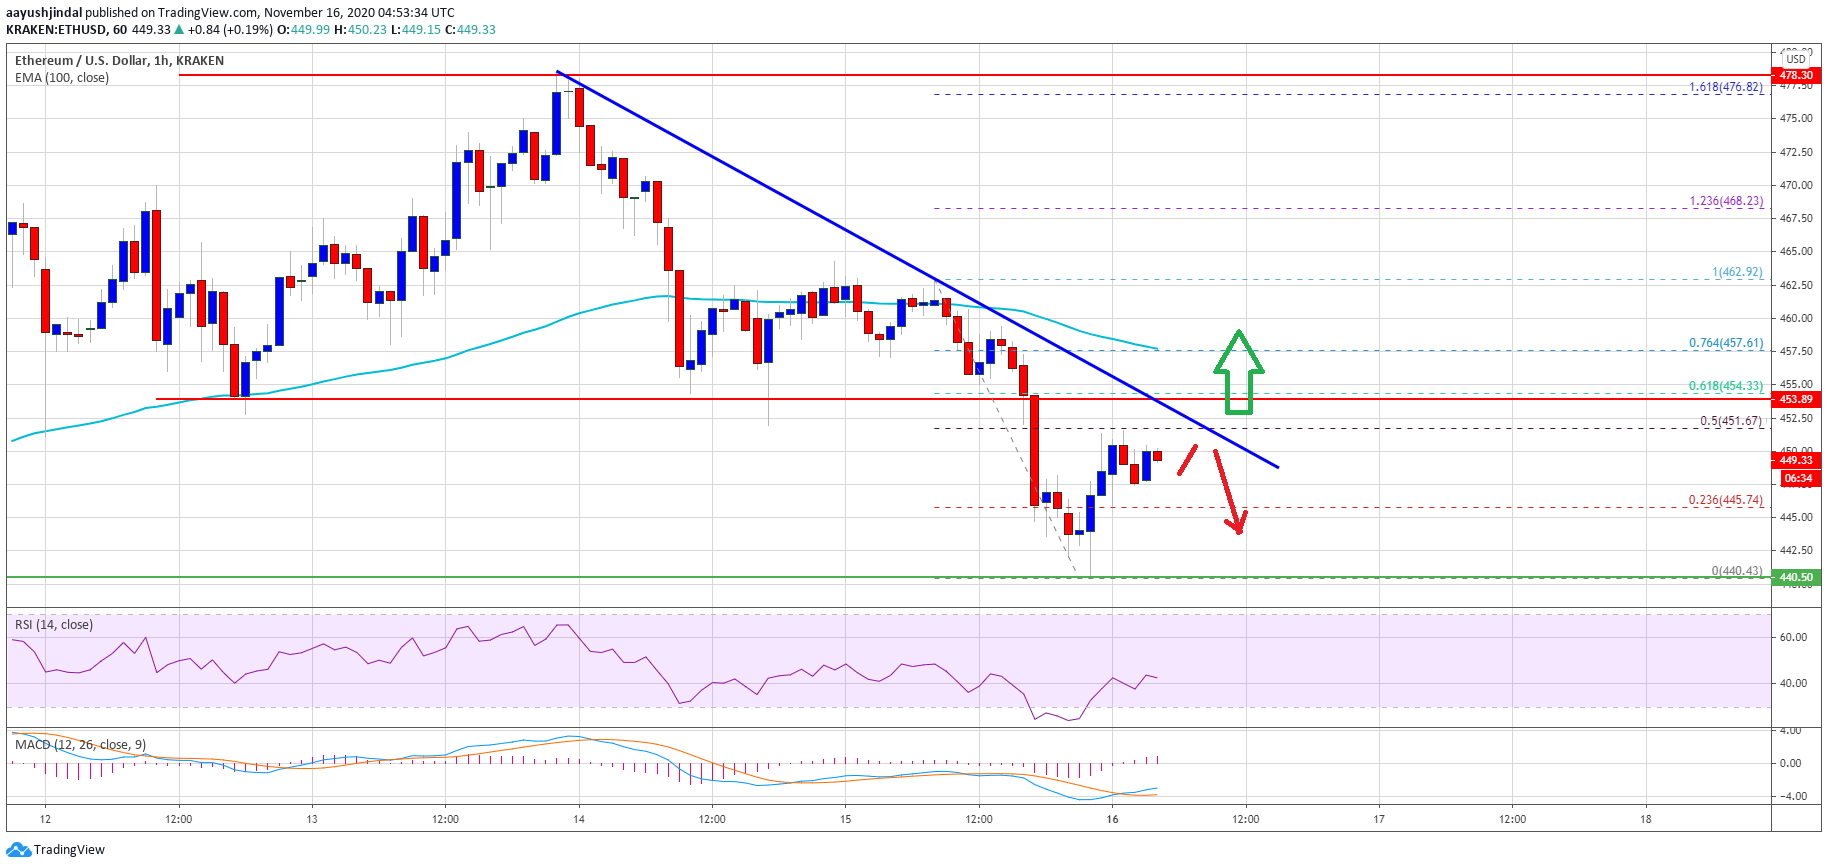
Source: ETHUSD on TradingView.com
There is also a key bearish trend line forming with resistance near $453 on the hourly chart of ETH/USD. The trend line is close to the 50% Fib retracement level of the recent decline from the $462 high to $440 low. The next major resistance is near the $460 level and the 100 hourly simple moving average.
A successful close above the $460 level and the 100 hourly simple moving average could start a fresh increase. In the stated case, the price could rally towards the $478-$480 resistance zone.
More Downsides in ETH?
If there is no upside break above the $452 and $460 resistance levels, ethereum might extend its decline. An initial support is near the $445 level.
The main support is now forming near the $442 and $440 levels. Any more losses could trigger a larger decline towards the $432 and $425 support levels in the near term.
Technical Indicators
Hourly MACD – The MACD for ETH/USD is slowly gaining momentum in the bullish zone.
Hourly RSI – The RSI for ETH/USD is now approaching the 50 level.
Major Support Level – $440
Major Resistance Level – $460