
Reason to trust
How Our News is Made
Strict editorial policy that focuses on accuracy, relevance, and impartiality
Ad discliamer
Morbi pretium leo et nisl aliquam mollis. Quisque arcu lorem, ultricies quis pellentesque nec, ullamcorper eu odio.
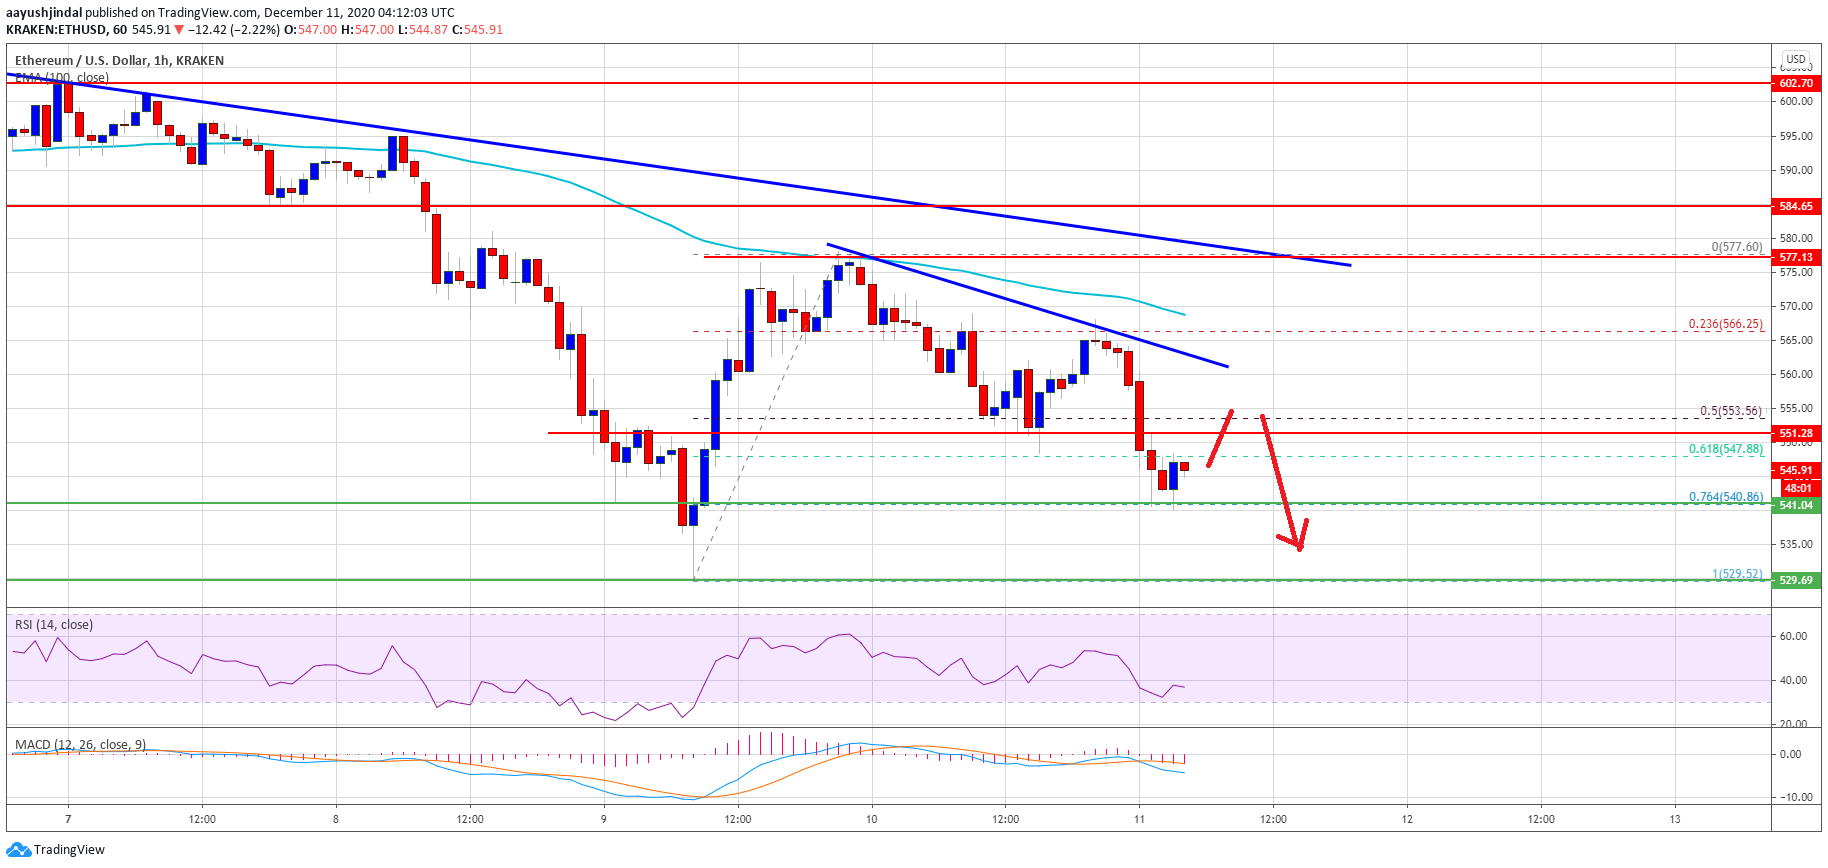
Ethereum failed to surpass the main $580 resistance against the US Dollar. ETH price is declining and it is showing bearish signs below the $560 and $550 levels.
- Ethereum topped near the $577 level and started a fresh decline below $565.
- The price is showing bearish signs below the $550 zone and the 100 hourly simple moving average.
- There are two key bearish trend lines forming with resistance near $560 and $575 on the hourly chart of ETH/USD (data feed via Kraken).
- The pair remains at a risk of a sharp decline below the $540 and $530 levels in the near term.
Ethereum Price is Slowly Declining
There was a failed attempt by Ethereum to clear the $580 resistance zone. ETH price traded as high as $577 and recently started a fresh decline. There was a break below the $565 pivot level to spark a fresh downward move.
Bitcoin price also moved below the $18,000 support and ripple declined below $0.565. Ether price broke the $550 support level. There was a clear break below the 50% Fib retracement level of the upward move from the $530 swing low to $577 high.
The price is now showing bearish signs below the $550 zone and the 100 hourly simple moving average. An initial support is near the $540 level. It is close to the 76.4% Fib retracement level of the upward move from the $530 swing low to $577 high.
Source: ETHUSD on TradingView.com
On the upside, the bulls are facing many hurdles, starting with $555. There are also two key bearish trend lines forming with resistance near $560 and $575 on the hourly chart of ETH/USD.
To move into a positive zone, ether must gain momentum above $560 and then clear the bearish trend line. The main resistance is still near the $580 zone.
More Losses in ETH?
If ethereum fails to clear the $555 and $560 resistance levels, it could continue to move down. An initial support zone is forming near the $540 level.
The next major support is near the $530 swing low, below which there is a risk of a larger decline. In the stated case, the price could even break the $520 support and revisit $500.
Technical Indicators
Hourly MACD – The MACD for ETH/USD is gaining momentum in the bearish zone.
Hourly RSI – The RSI for ETH/USD is currently well below the 50 level.
Major Support Level – $530
Major Resistance Level – $565


