
Reason to trust
How Our News is Made
Strict editorial policy that focuses on accuracy, relevance, and impartiality
Ad discliamer
Morbi pretium leo et nisl aliquam mollis. Quisque arcu lorem, ultricies quis pellentesque nec, ullamcorper eu odio.
Ethereum is trading nicely above the $1,850 support against the US Dollar. ETH price is likely to start a strong increase above $1,900 and it could even clear the $2,000 resistance.
- Ethereum traded as high as $1,943 before correcting lower below $1,900.
- The price is now trading nicely above $1,850 and the 100 hourly simple moving average.
- There is a key bullish flag forming with resistance near $1,890 on the hourly chart of ETH/USD (data feed via Kraken).
- The pair is likely to start a strong rally if there is a close above the $1,900 resistance.
Ethereum Price Could Accelerate Higher
Ethereum traded above the $1,900 resistance when bitcoin climbed above $60,000. ETH traded as high as $1,943 before it faced sellers.
As a result, there was a downside correction below the $1,920 and $1,900 levels. Ether price even declined below the $1,880 support level. There was a break below the 23.6% Fib retracement level of the upward move from the $1,722 swing low to $1,943 high.
Ether is now trading nicely above $1,850 and the 100 hourly simple moving average. It is also holding the 50% Fib retracement level of the upward move from the $1,722 swing low to $1,943 high.
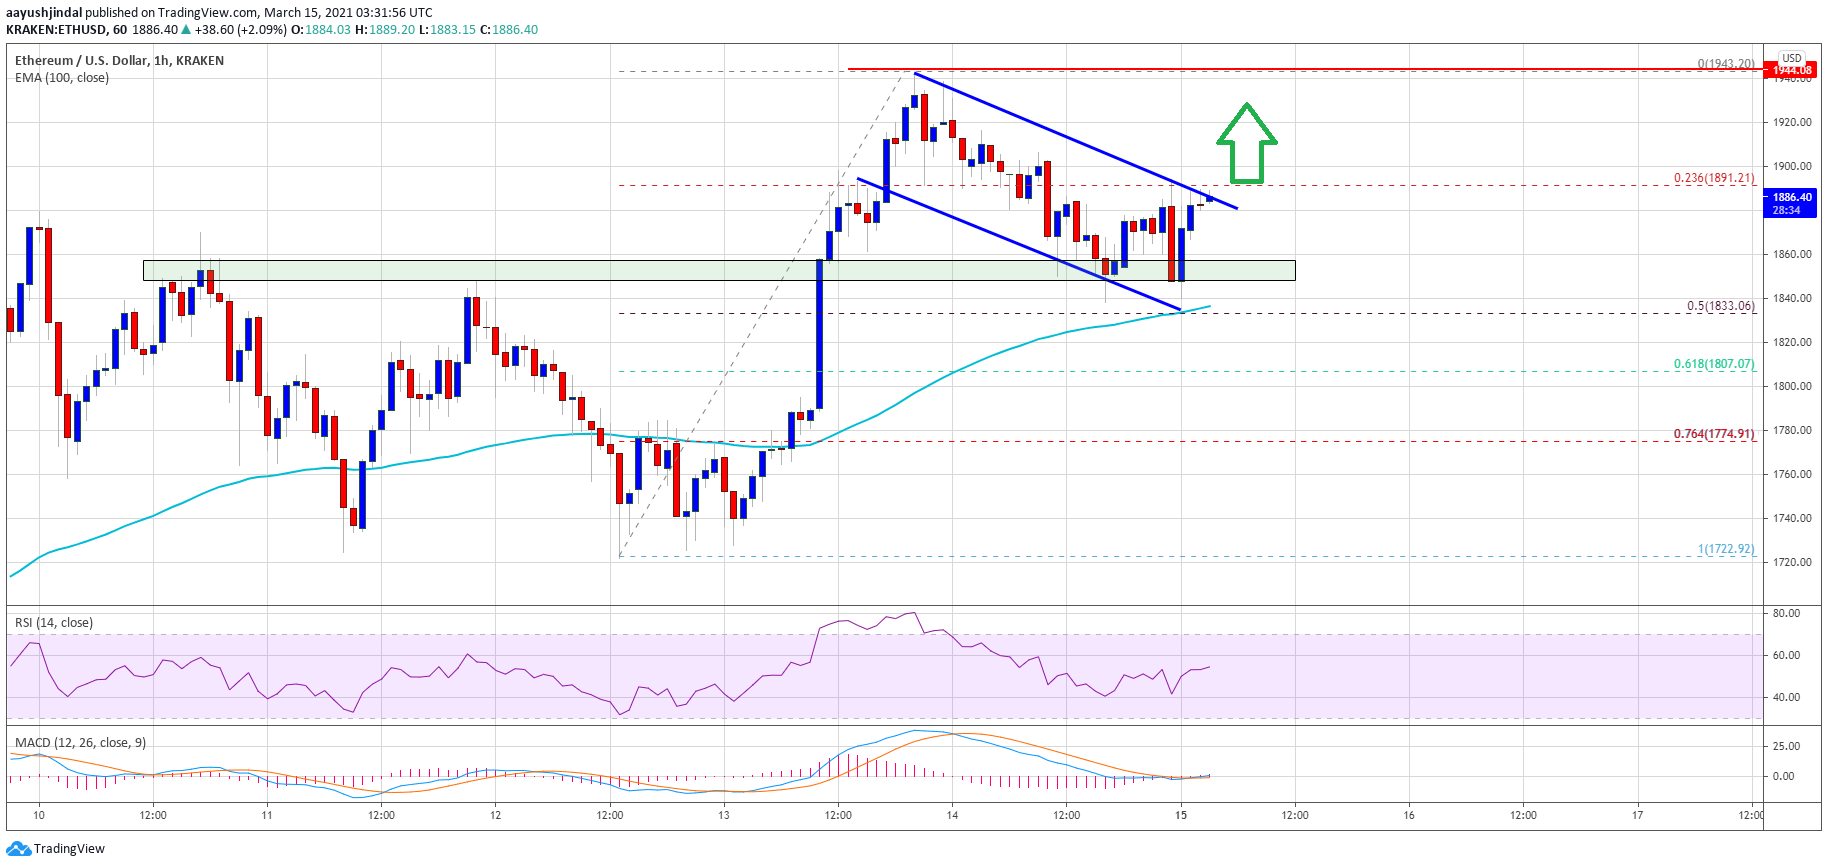
Source: ETHUSD on TradingView.com
There is also a key bullish flag forming with resistance near $1,890 on the hourly chart of ETH/USD. If there is an upside break above the flag resistance, there are chances of a strong increase above $1,900. The next key resistance is near the $1,950 level, above which the price may even clear the $2,000 resistance zone in the coming sessions.
Downside Break in ETH?
If Ethereum fails to continue higher above the $1,890 and $1,900 resistance levels, it could correct further lower. The first key support is near the $1,850 level.
The main support is now forming near the $1,830 level and the 100 hourly simple moving average. If there is a downside break below the $1,830 support, ether price might decline towards the $1,800 level. Any more losses could possibly call for a test of the key $1,750 support zone in the near term.
Technical Indicators
Hourly MACD – The MACD for ETH/USD is slowly gaining pace in the bullish zone.
Hourly RSI – The RSI for ETH/USD is now above the 50 level.
Major Support Level – $1,830
Major Resistance Level – $1,900


