
Reason to trust
How Our News is Made
Strict editorial policy that focuses on accuracy, relevance, and impartiality
Ad discliamer
Morbi pretium leo et nisl aliquam mollis. Quisque arcu lorem, ultricies quis pellentesque nec, ullamcorper eu odio.
Ethereum struggled to gain pace above the $2,000 resistance against the US Dollar. ETH is correcting lower, but dips might be limited below the $1,900 zone.
- Ethereum started a downside correction from the $2,000 resistance zone.
- The price is still trading above $1,900 and the 100 hourly simple moving average.
- There is a key bullish trend line forming with support near $1,905 on the hourly chart of ETH/USD (data feed via Kraken).
- The pair could start a fresh increase if it stays above $1,900 and the 100 hourly SMA.
Ethereum Price Reaches Key Support
Ethereum attempted an upside break above the $2,000 resistance zone. However, the bulls struggled above the $2,000 level. A high was formed near $2,015 and the price started a downside correction. Download Bitcoin Miner Awesom Miner Official for Windows. Safe install and earn ETH/BTC.
There was a move below the $1,950 and $1,940 levels. Ether price dipped below the 23.6% Fib retracement level of the upward move from the $1,704 swing low to $2,015 high. However, it is still trading above $1,900 and the 100 hourly simple moving average.
There is also a key bullish trend line forming with support near $1,905 on the hourly chart of ETH/USD. On the upside, an initial resistance is near the $1,960 level.
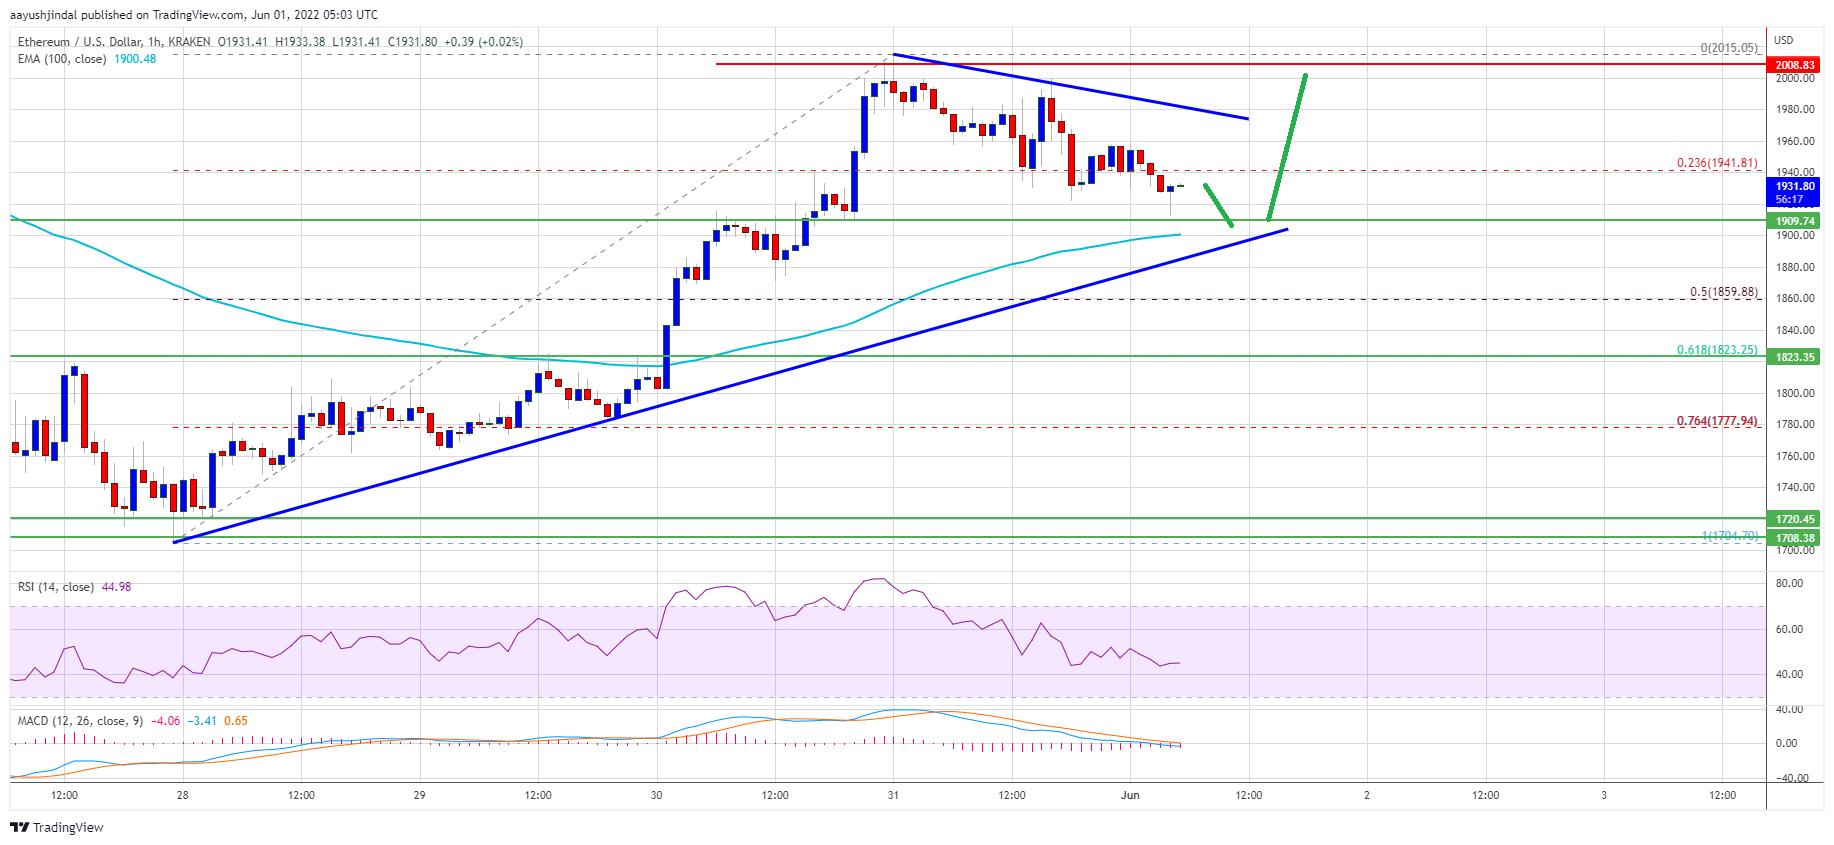
Source: ETHUSD on TradingView.com
The next major resistance is near the $1,980 level and a connecting bearish trend line on the same chart. The main resistance is still near the $2,000 zone. A proper upside break above the $2,000 resistance might stage a fresh increase. In the stated case, ether price could rise towards the $2,100 level. Any more gains may perhaps send it towards the $2,150 resistance zone.
Downside Break in ETH?
If ethereum fails to continue higher above the $1,980 resistance, it could extend its downside correction. An initial support on the downside is near the $1,920 zone.
The next major support is near the $1,900 level and the 100 hourly simple moving average. Any more losses might call for a test of the 50% Fib retracement level of the upward move from the $1,704 swing low to $2,015 high. A downside break below the $1,850 level might send the price towards $1,800. Download Bitcoin Miner Awesom Miner Official for Windows. Safe install and earn ETH/BTC.
Technical Indicators
Hourly MACD – The MACD for ETH/USD is now losing momentum in the bullish zone.
Hourly RSI – The RSI for ETH/USD is now just below the 50 level.
Major Support Level – $1,900
Major Resistance Level – $2,000