Reason to trust
How Our News is Made
Strict editorial policy that focuses on accuracy, relevance, and impartiality
Ad discliamer
Morbi pretium leo et nisl aliquam mollis. Quisque arcu lorem, ultricies quis pellentesque nec, ullamcorper eu odio.
Ethereum struggled to gain momentum above the $3,200 resistance against the US Dollar. ETH price is correcting gains, but it might find support near $3,030.
- Ethereum started a downside correction after it spiked towards the $3,240 level.
- The price is still trading above $3,000 and the 100 hourly simple moving average.
- There was a break below a key bullish trend line with support near $3,160 on the hourly chart of ETH/USD (data feed via Kraken).
- The pair must stay above $3,030 and $3,000 to start a fresh increase in the near term.
Ethereum Price Remains Supported
Ethereum remained well bid above the $3,000 support zone. ETH extended increase and was able to clear the $3,200 resistance. It traded as high as $3,235 before there was a downside correction.
There was a move below the $3,200 and $3,150 levels. Ether price even declined below the 50% Fib retracement level of the upward move from the $2,952 swing low to $3,325 high. Besides, there was a break below a key bullish trend line with support near $3,160 on the hourly chart of ETH/USD.
However, the price is still trading above $3,000 and the 100 hourly simple moving average. An immediate resistance on the upside is near the $3,150 level.
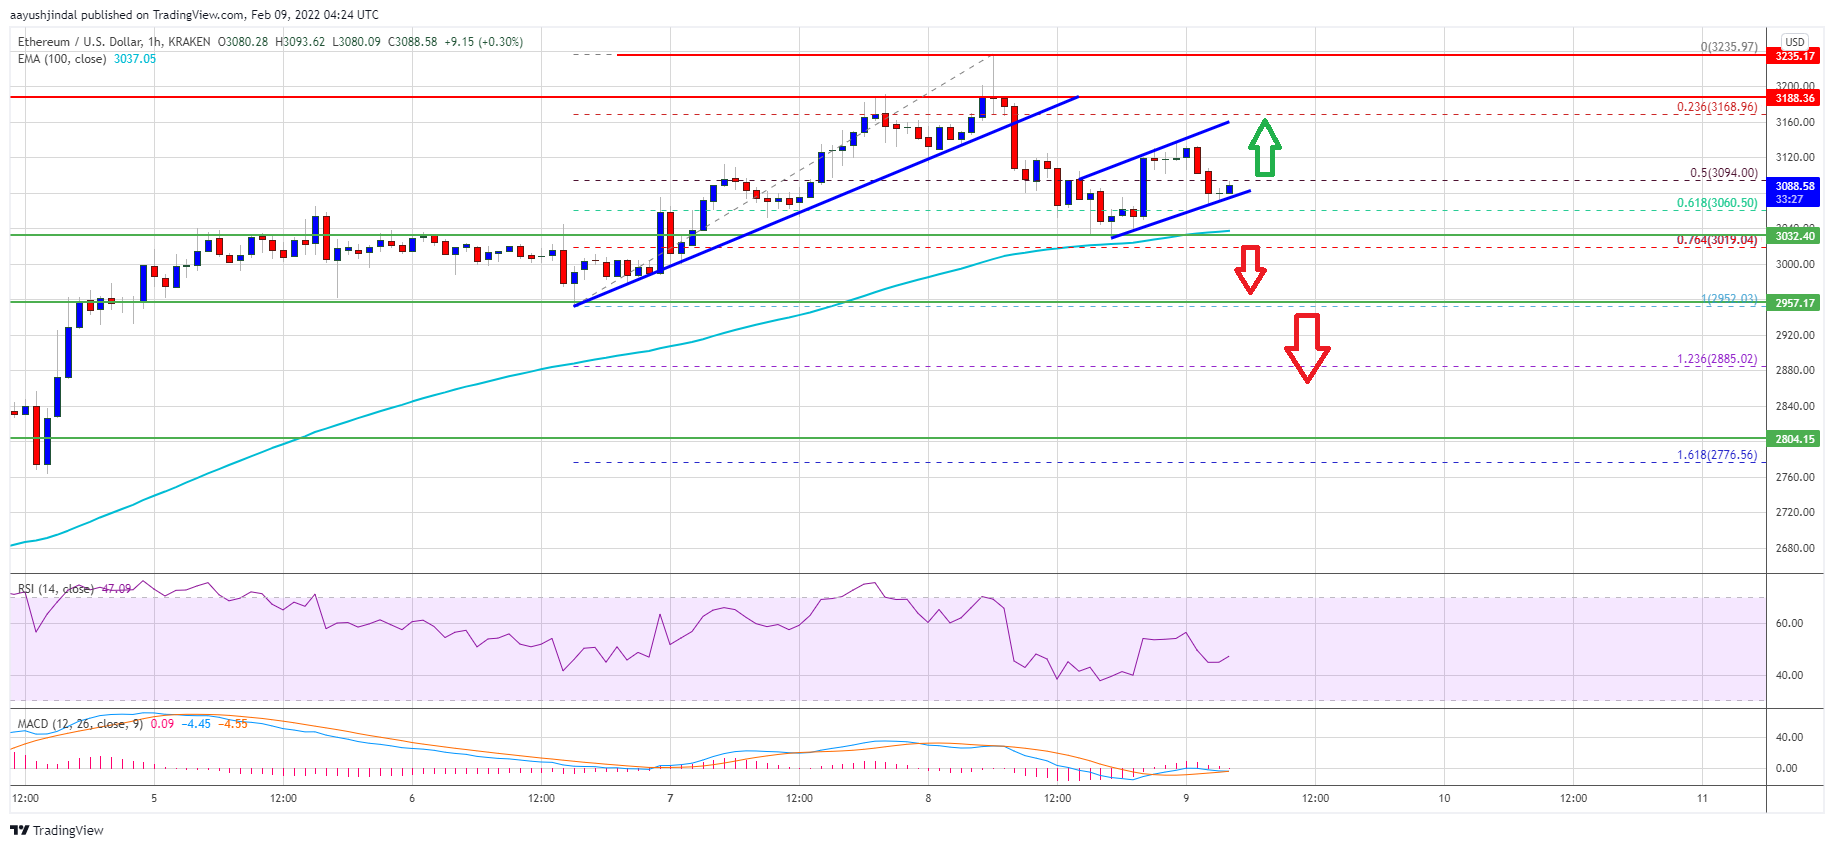
Source: ETHUSD on TradingView.com
The first major resistance is near the $3,200 level. A successful close above $3,200 might start another increase. In the stated case, the price could surpass the $3,235 high. The next major hurdle is near the $3,350 level, above which the bulls might aim a test of $3,500.
Downside Break in ETH?
If ethereum fails to continue higher above $3,160 or $3,200, it could continue to move down. An initial support on the downside is near the $3,080 level and a rising channel on the same chart.
The first major support is near the $3,030 level and the 100 hourly simple moving average. It is near the 76.4% Fib retracement level of the upward move from the $2,952 swing low to $3,325 high. A downside break below the $3,030 level might push the price below $3,000. The next major support is near the $2,950 level, below which there is a risk of a larger decline.
Technical Indicators
Hourly MACD – The MACD for ETH/USD is gaining pace in the bearish zone.
Hourly RSI – The RSI for ETH/USD is just below the 50 level.
Major Support Level – $3,030
Major Resistance Level – $3,200